How to use the IDAES Flowsheet Processor UI
Run an optimization
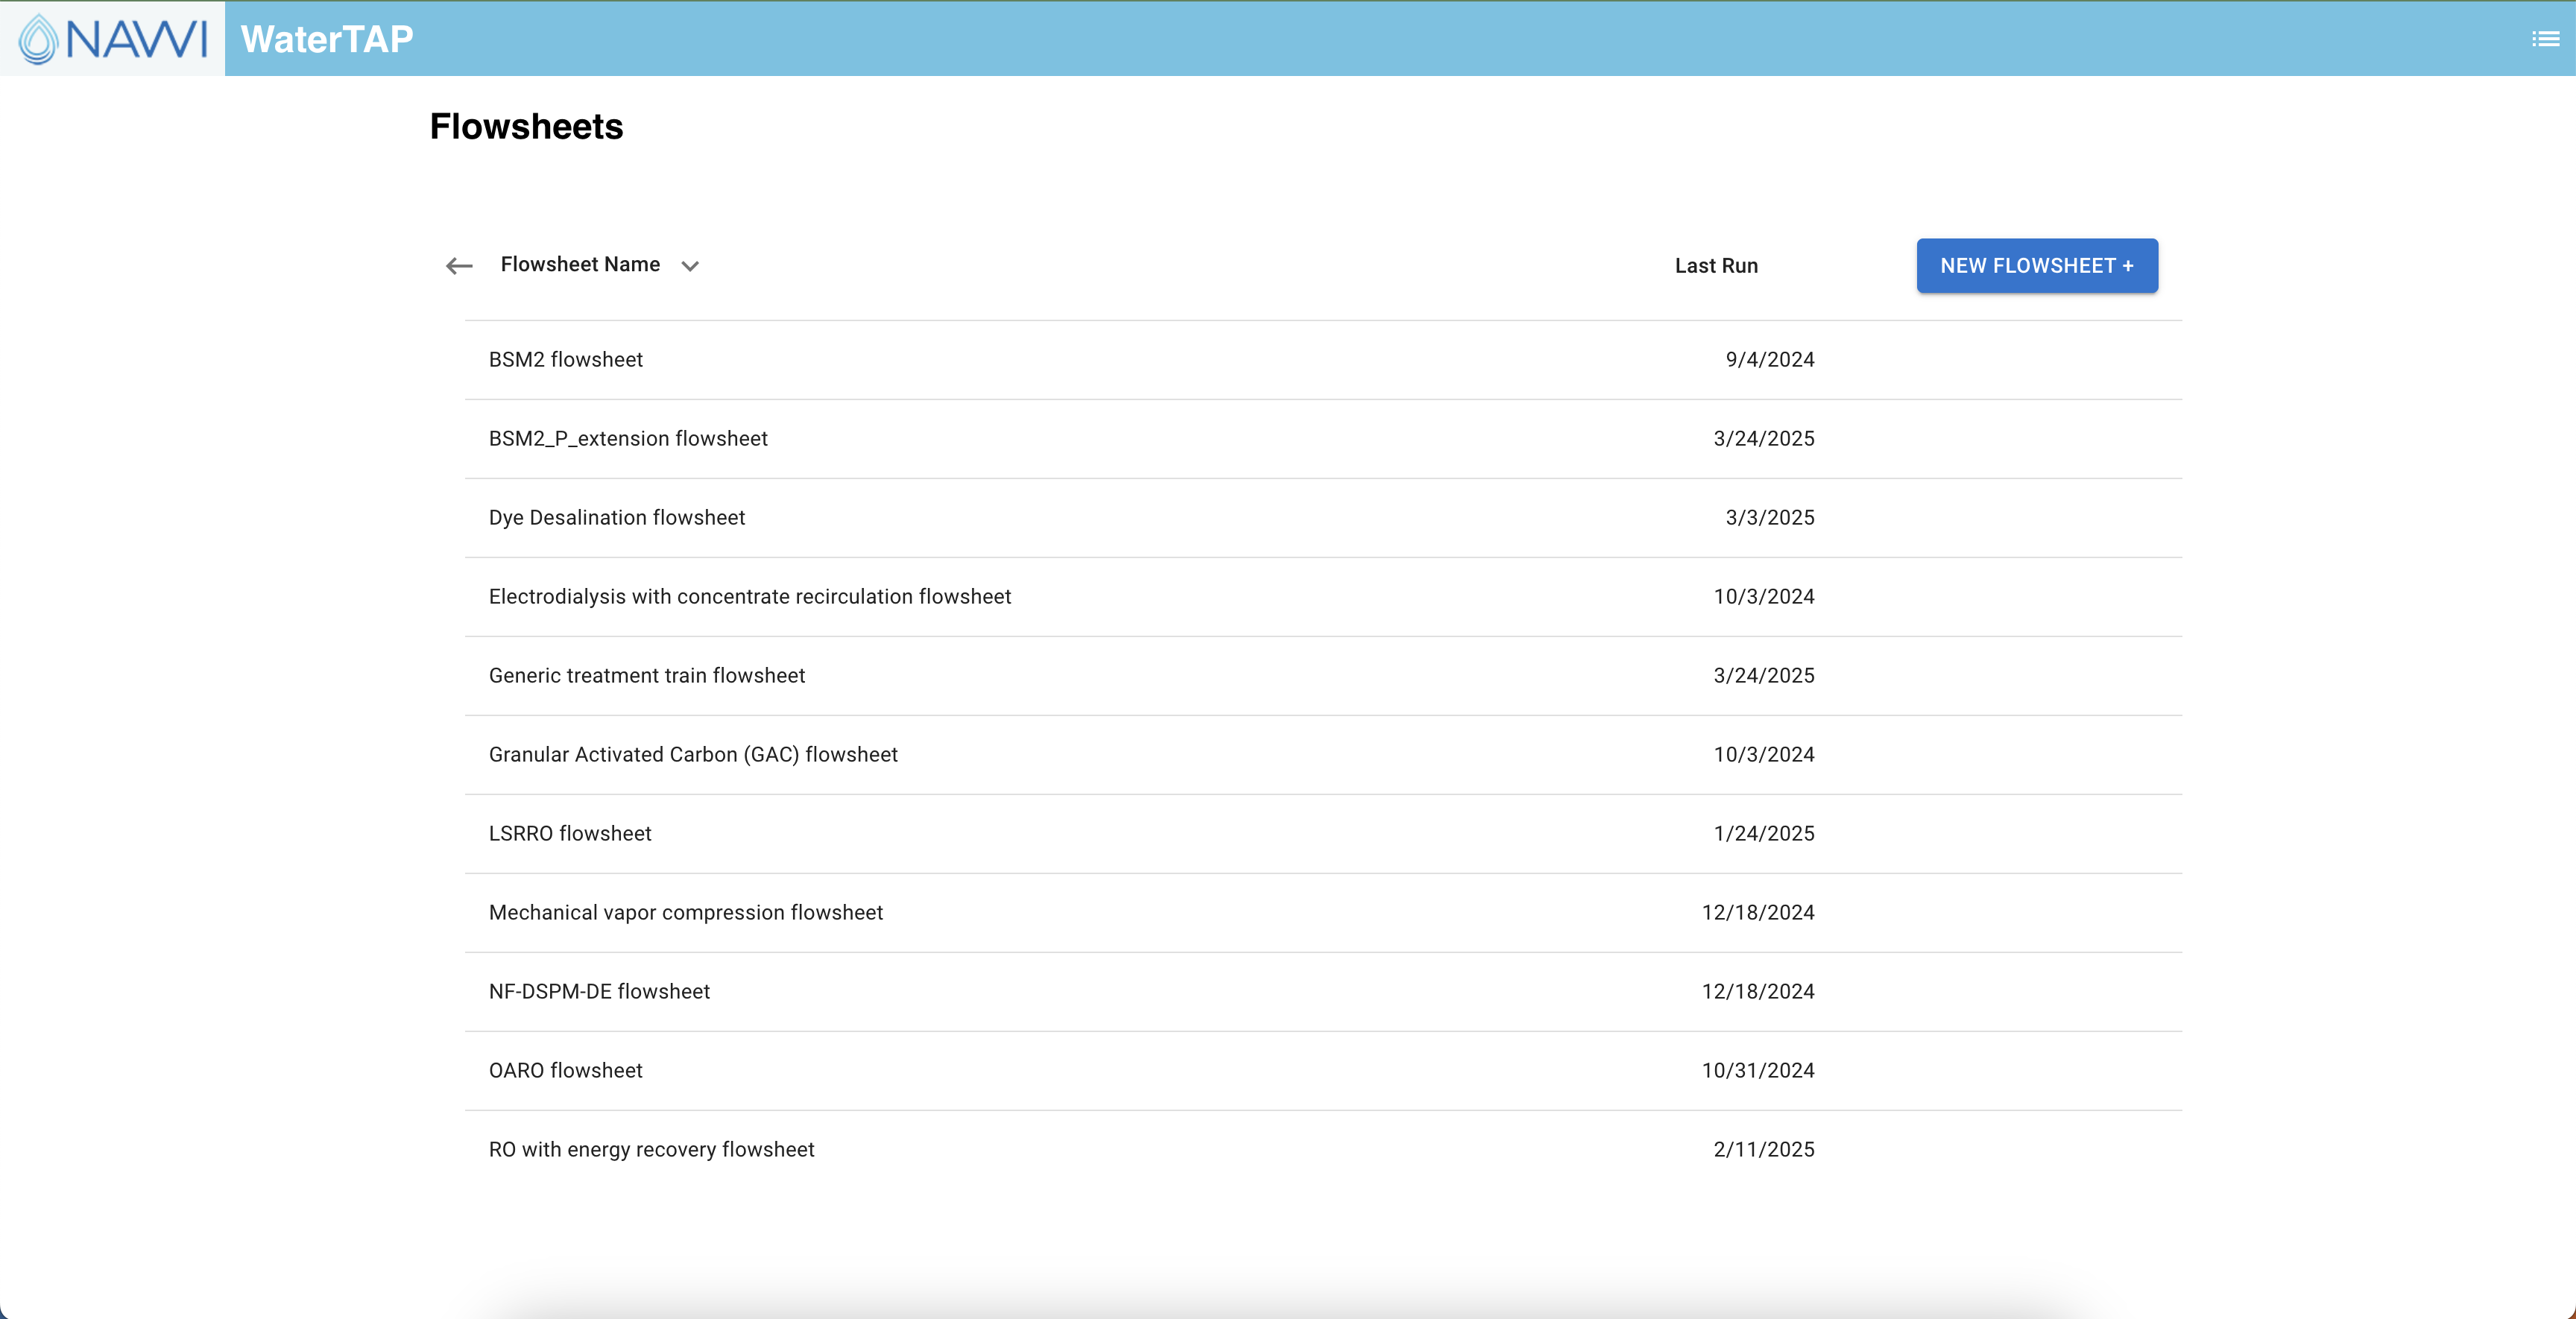
- Open up the application. After the application has finished initializing, you should see the default list of flowsheets. For WaterTAP, this should look like:
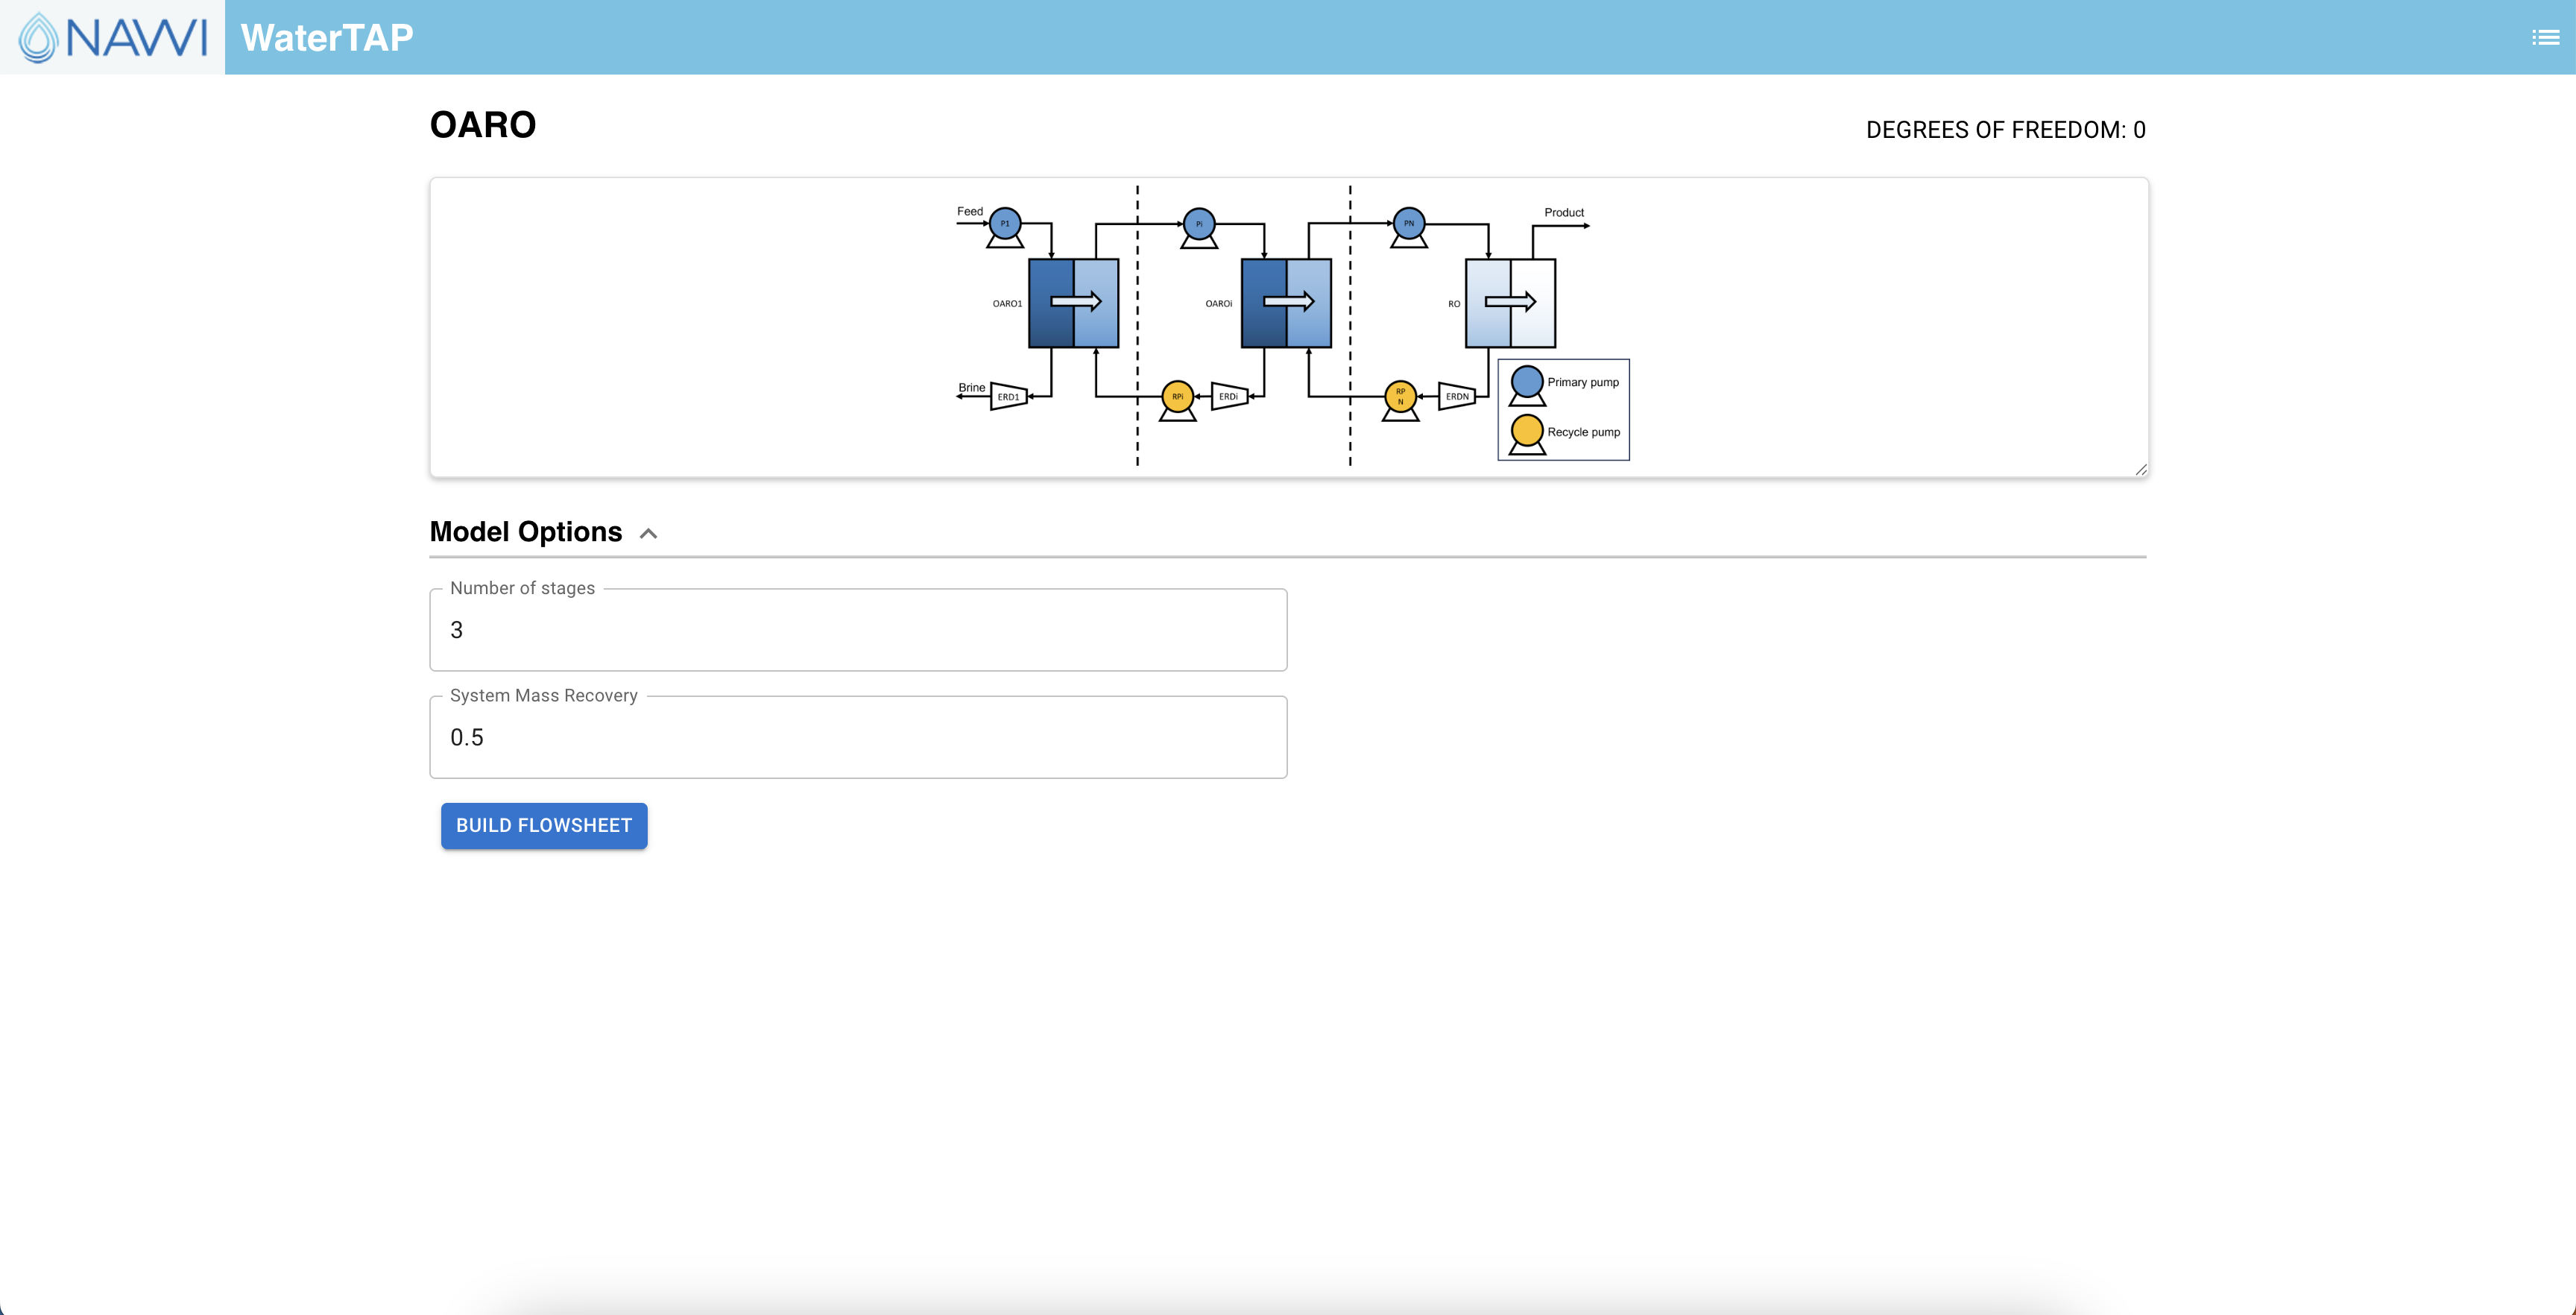
- Select a flowsheet. If that flowsheet has customizable model options, you will be prompted to choose values for those options. After doing so, click Build Flowsheet.
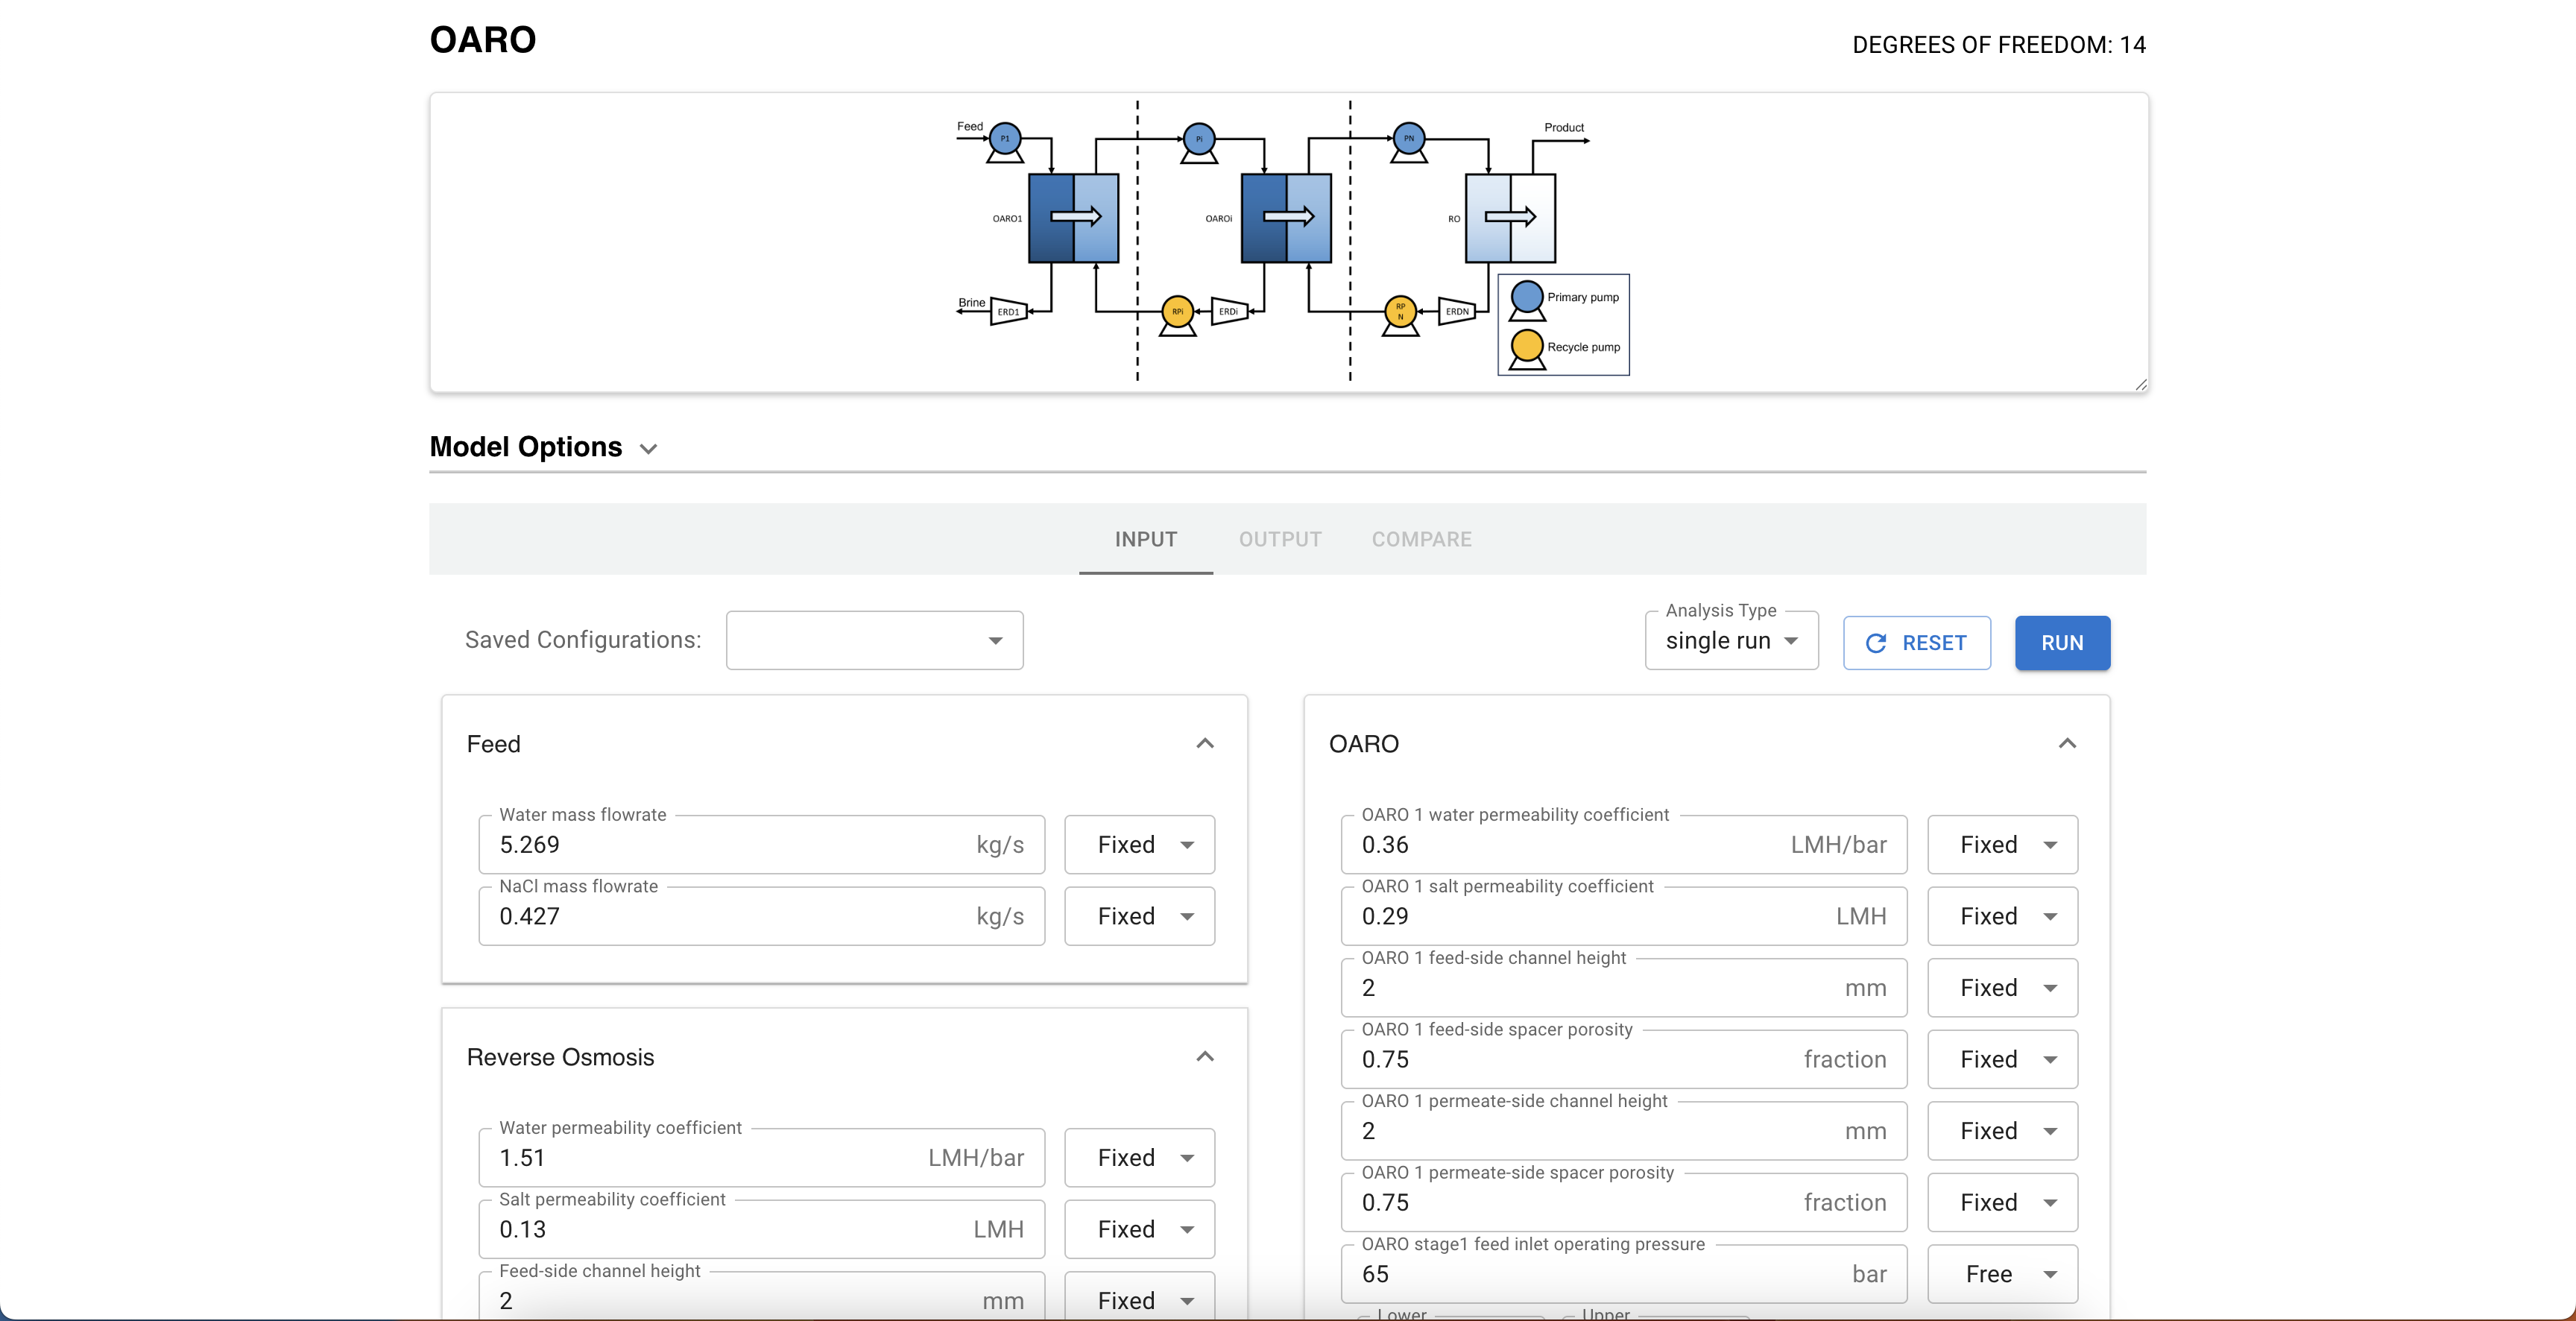
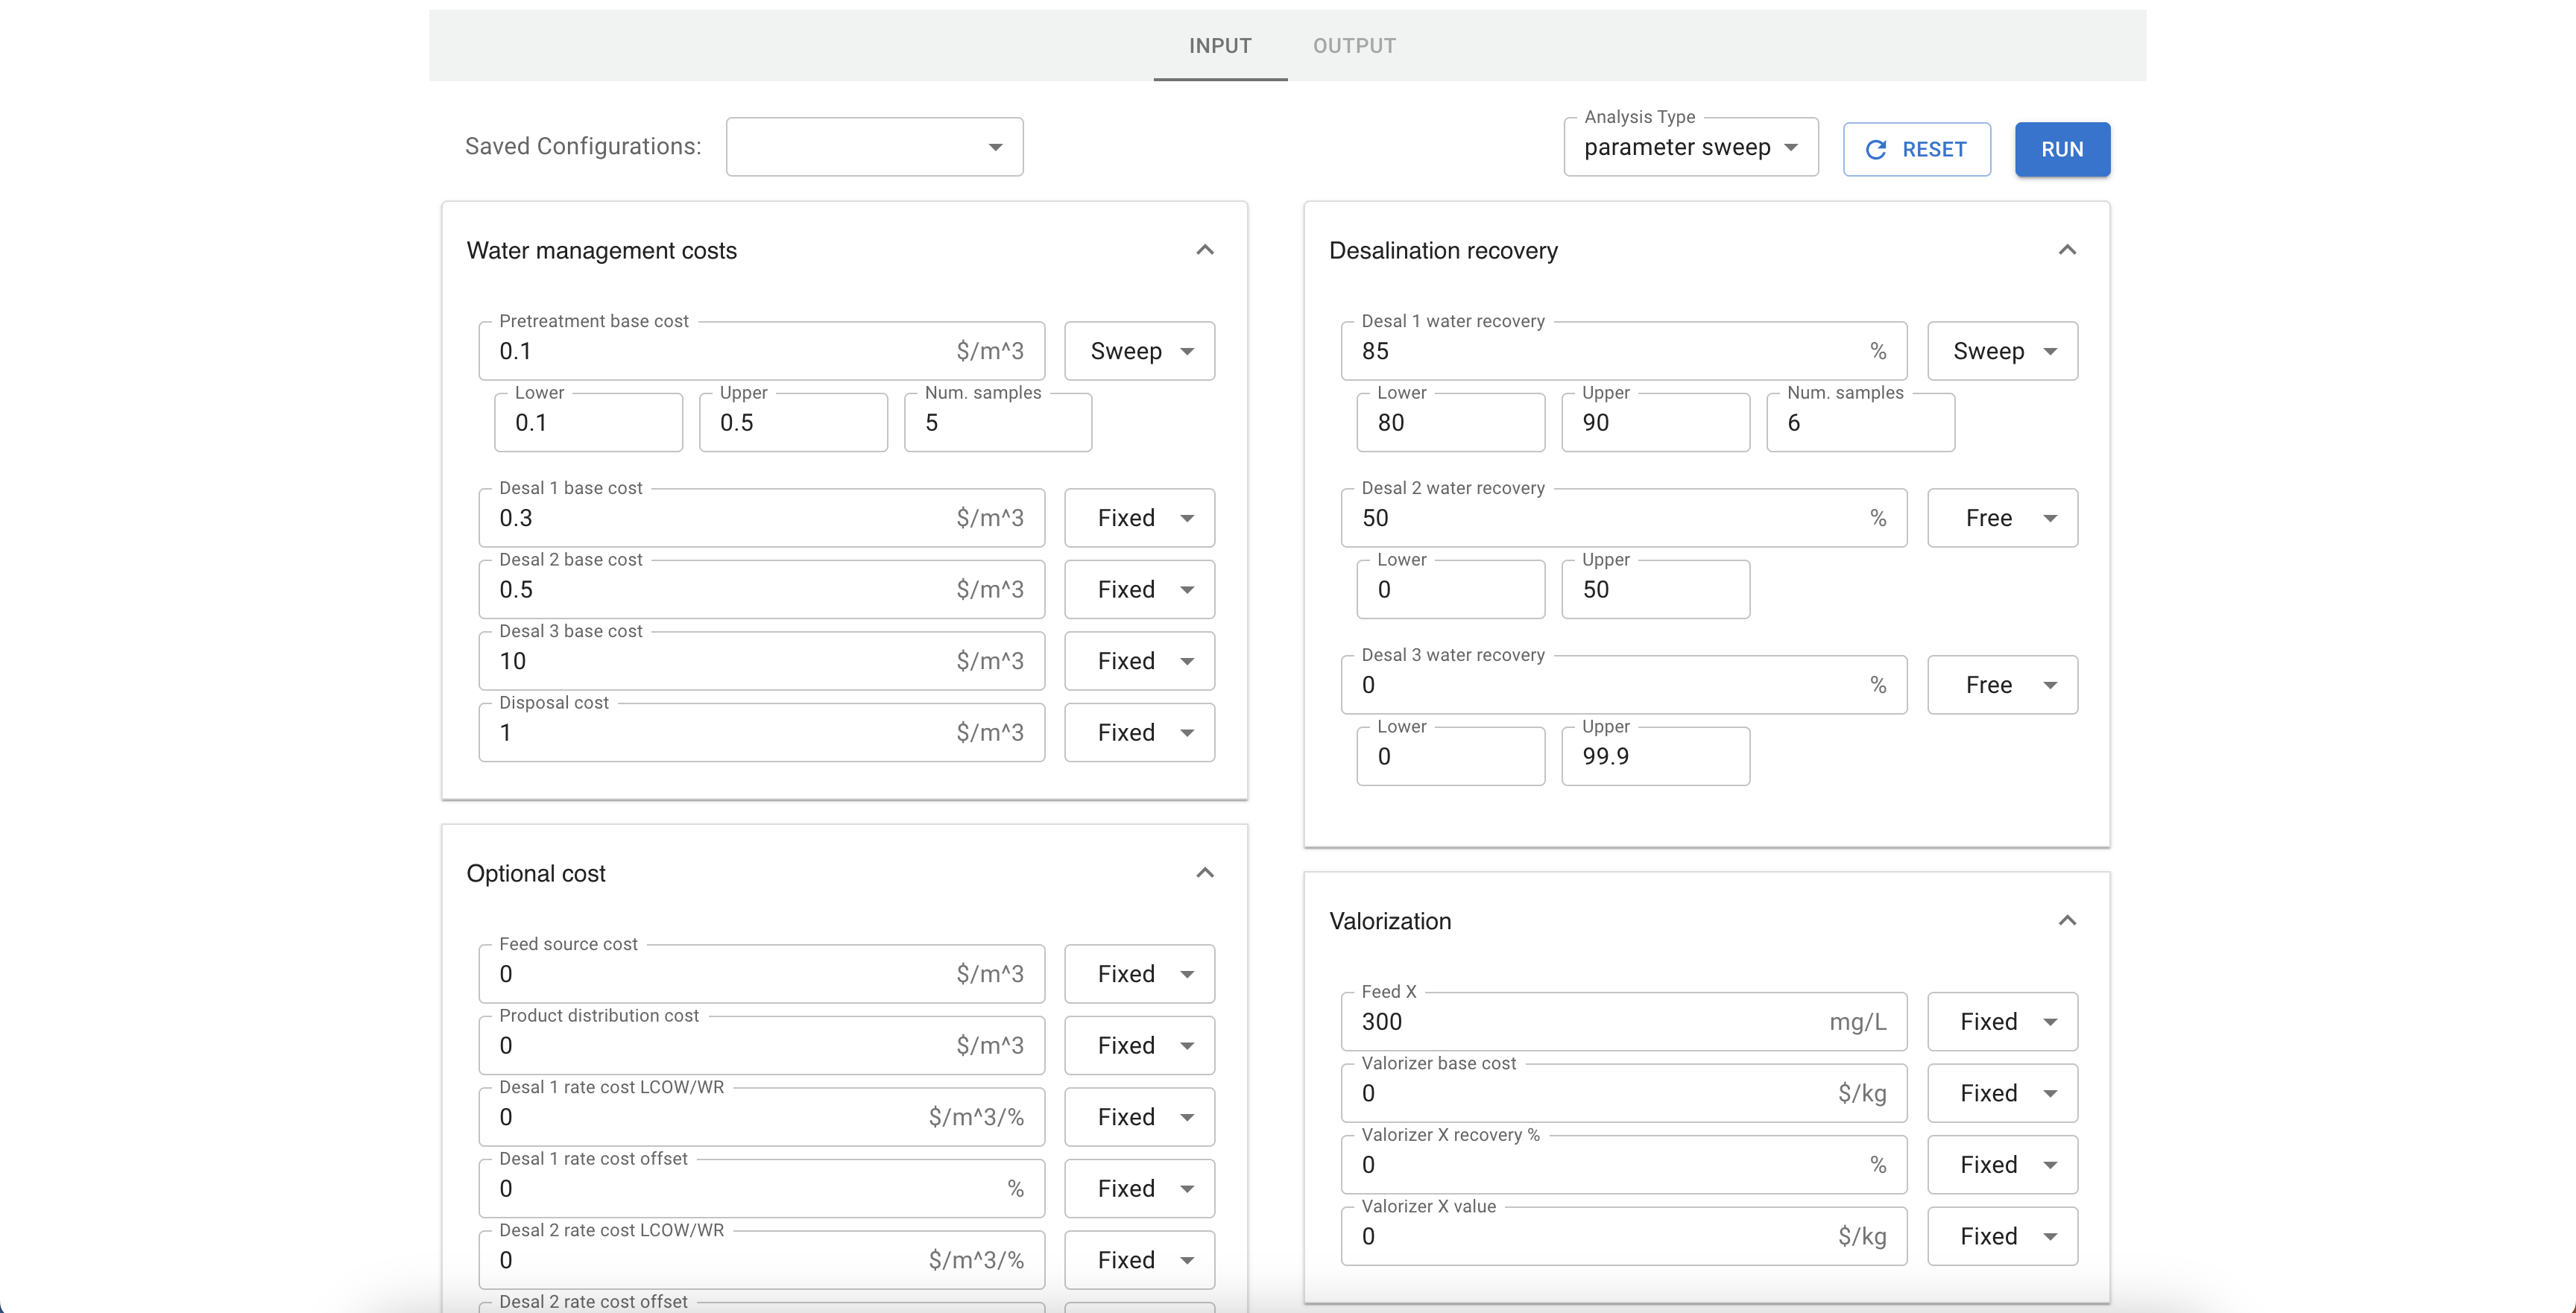
- After the flowsheet has finished building, you will be directed to the input page. Here you can update selected variables by changing the value, fixed status, and upper/lower bounds. You can also choose from previously saved configurations to autopopulate the input values. When ready to run the optimization, click the Run button.
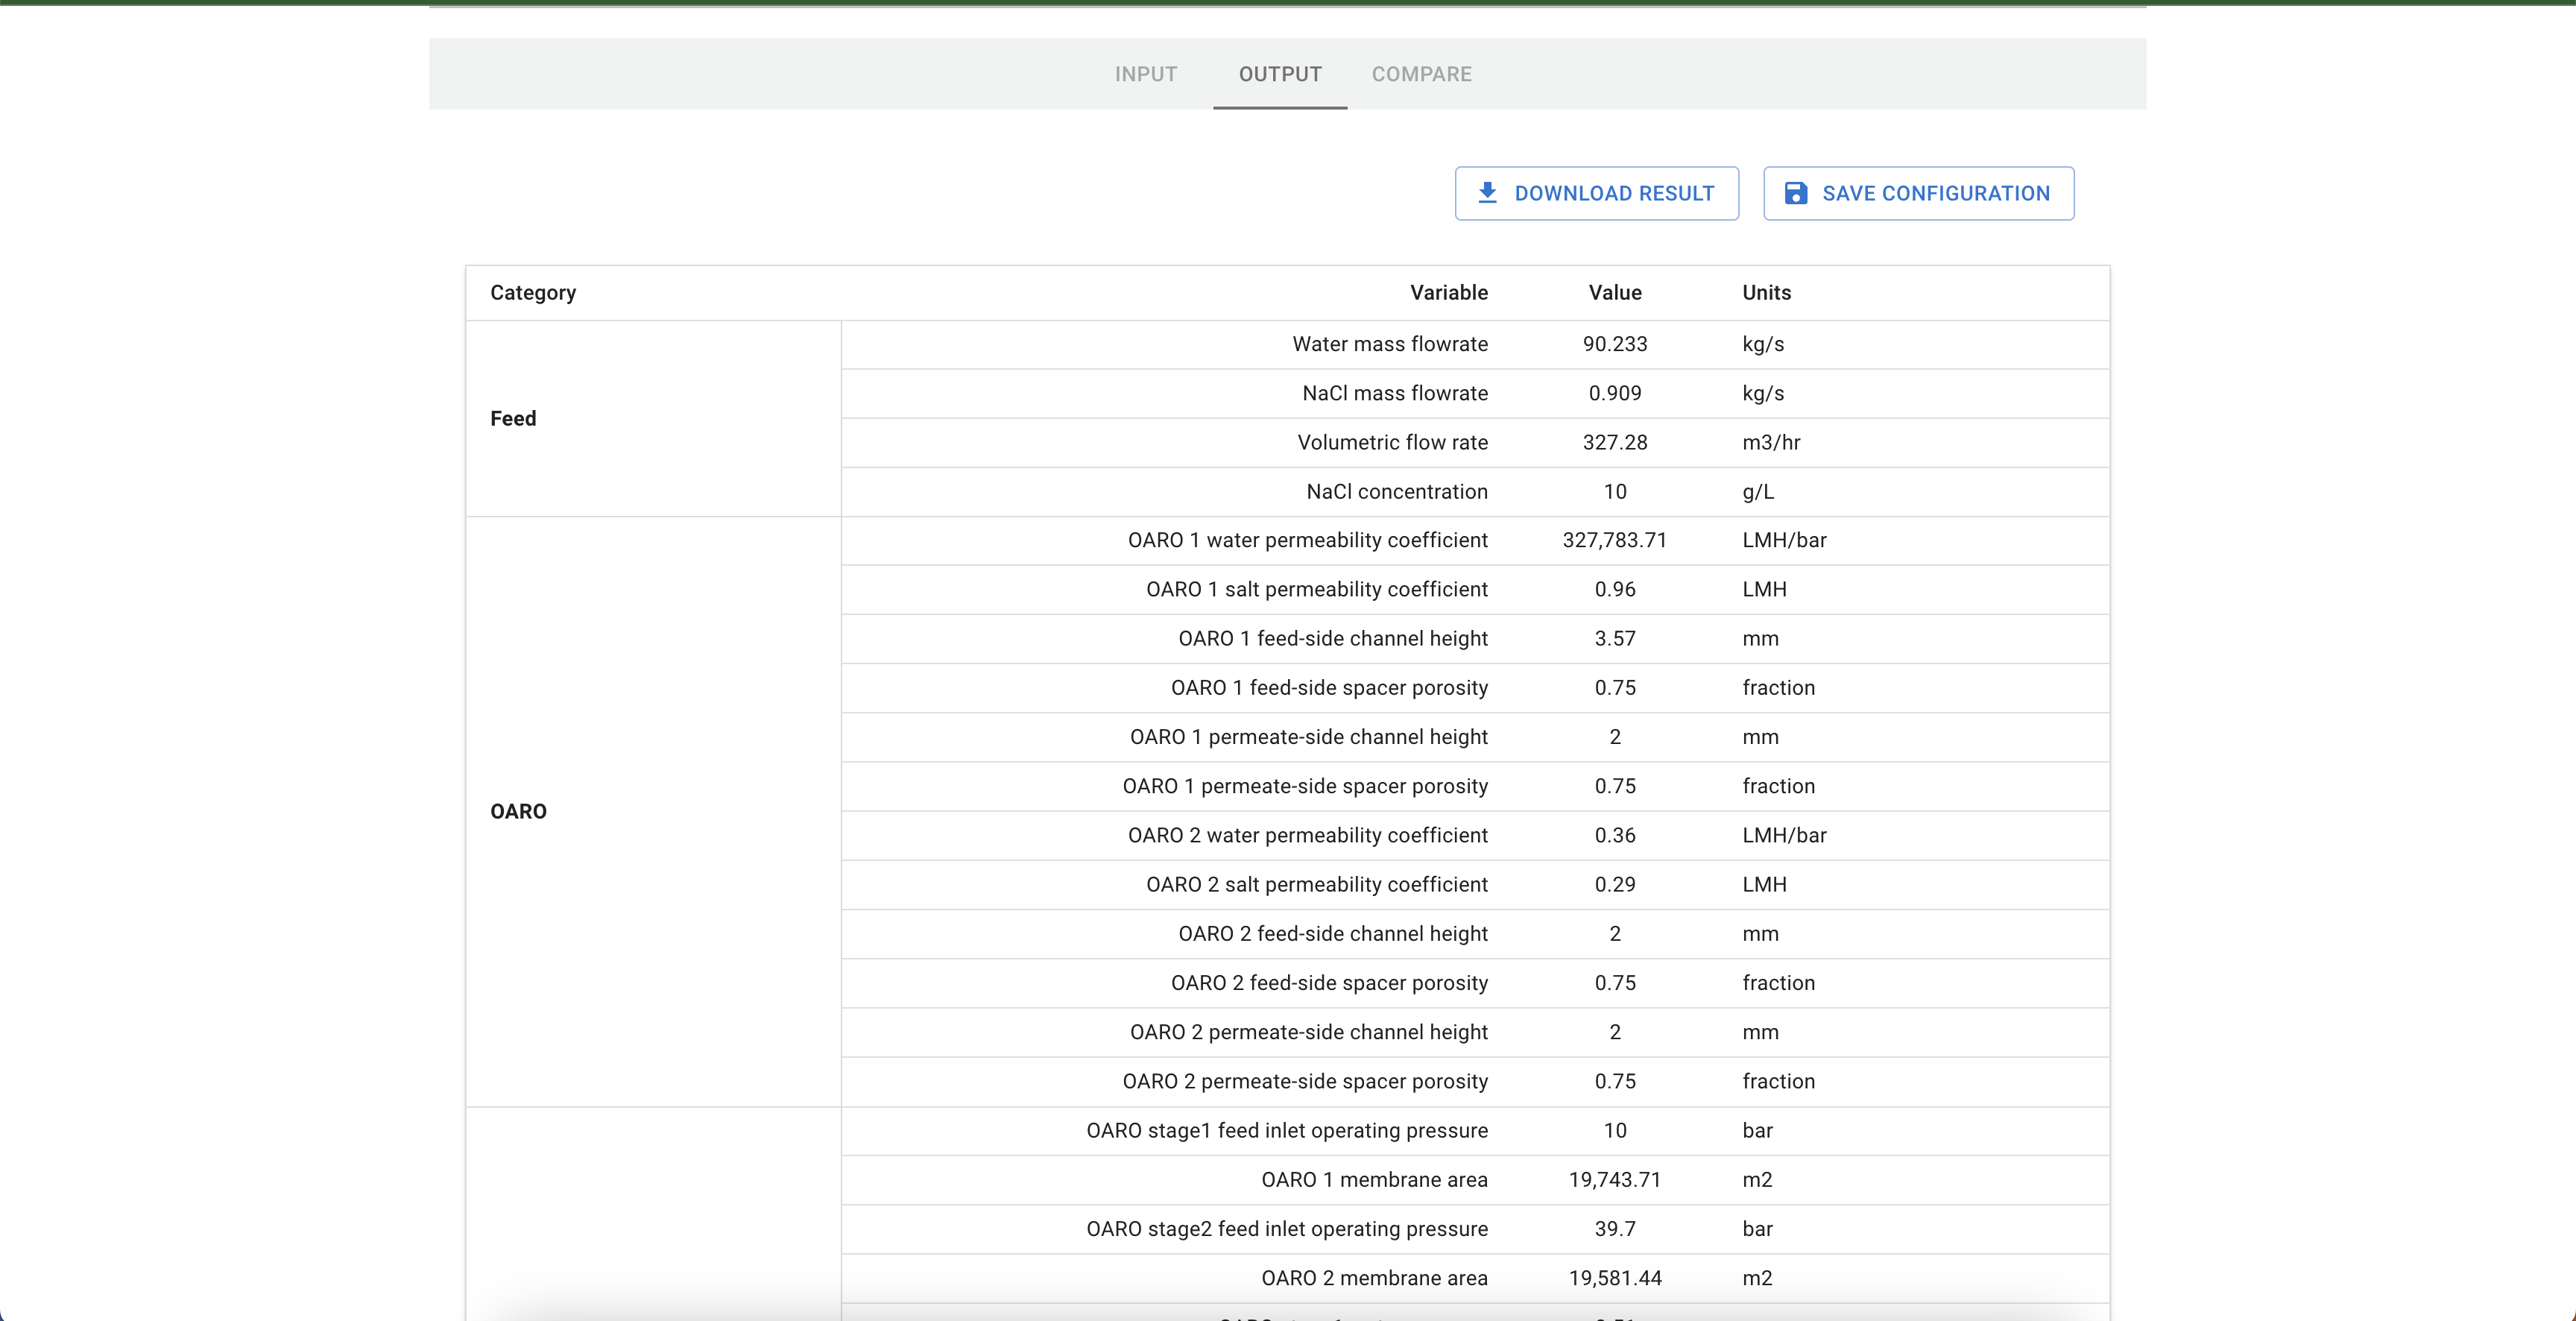
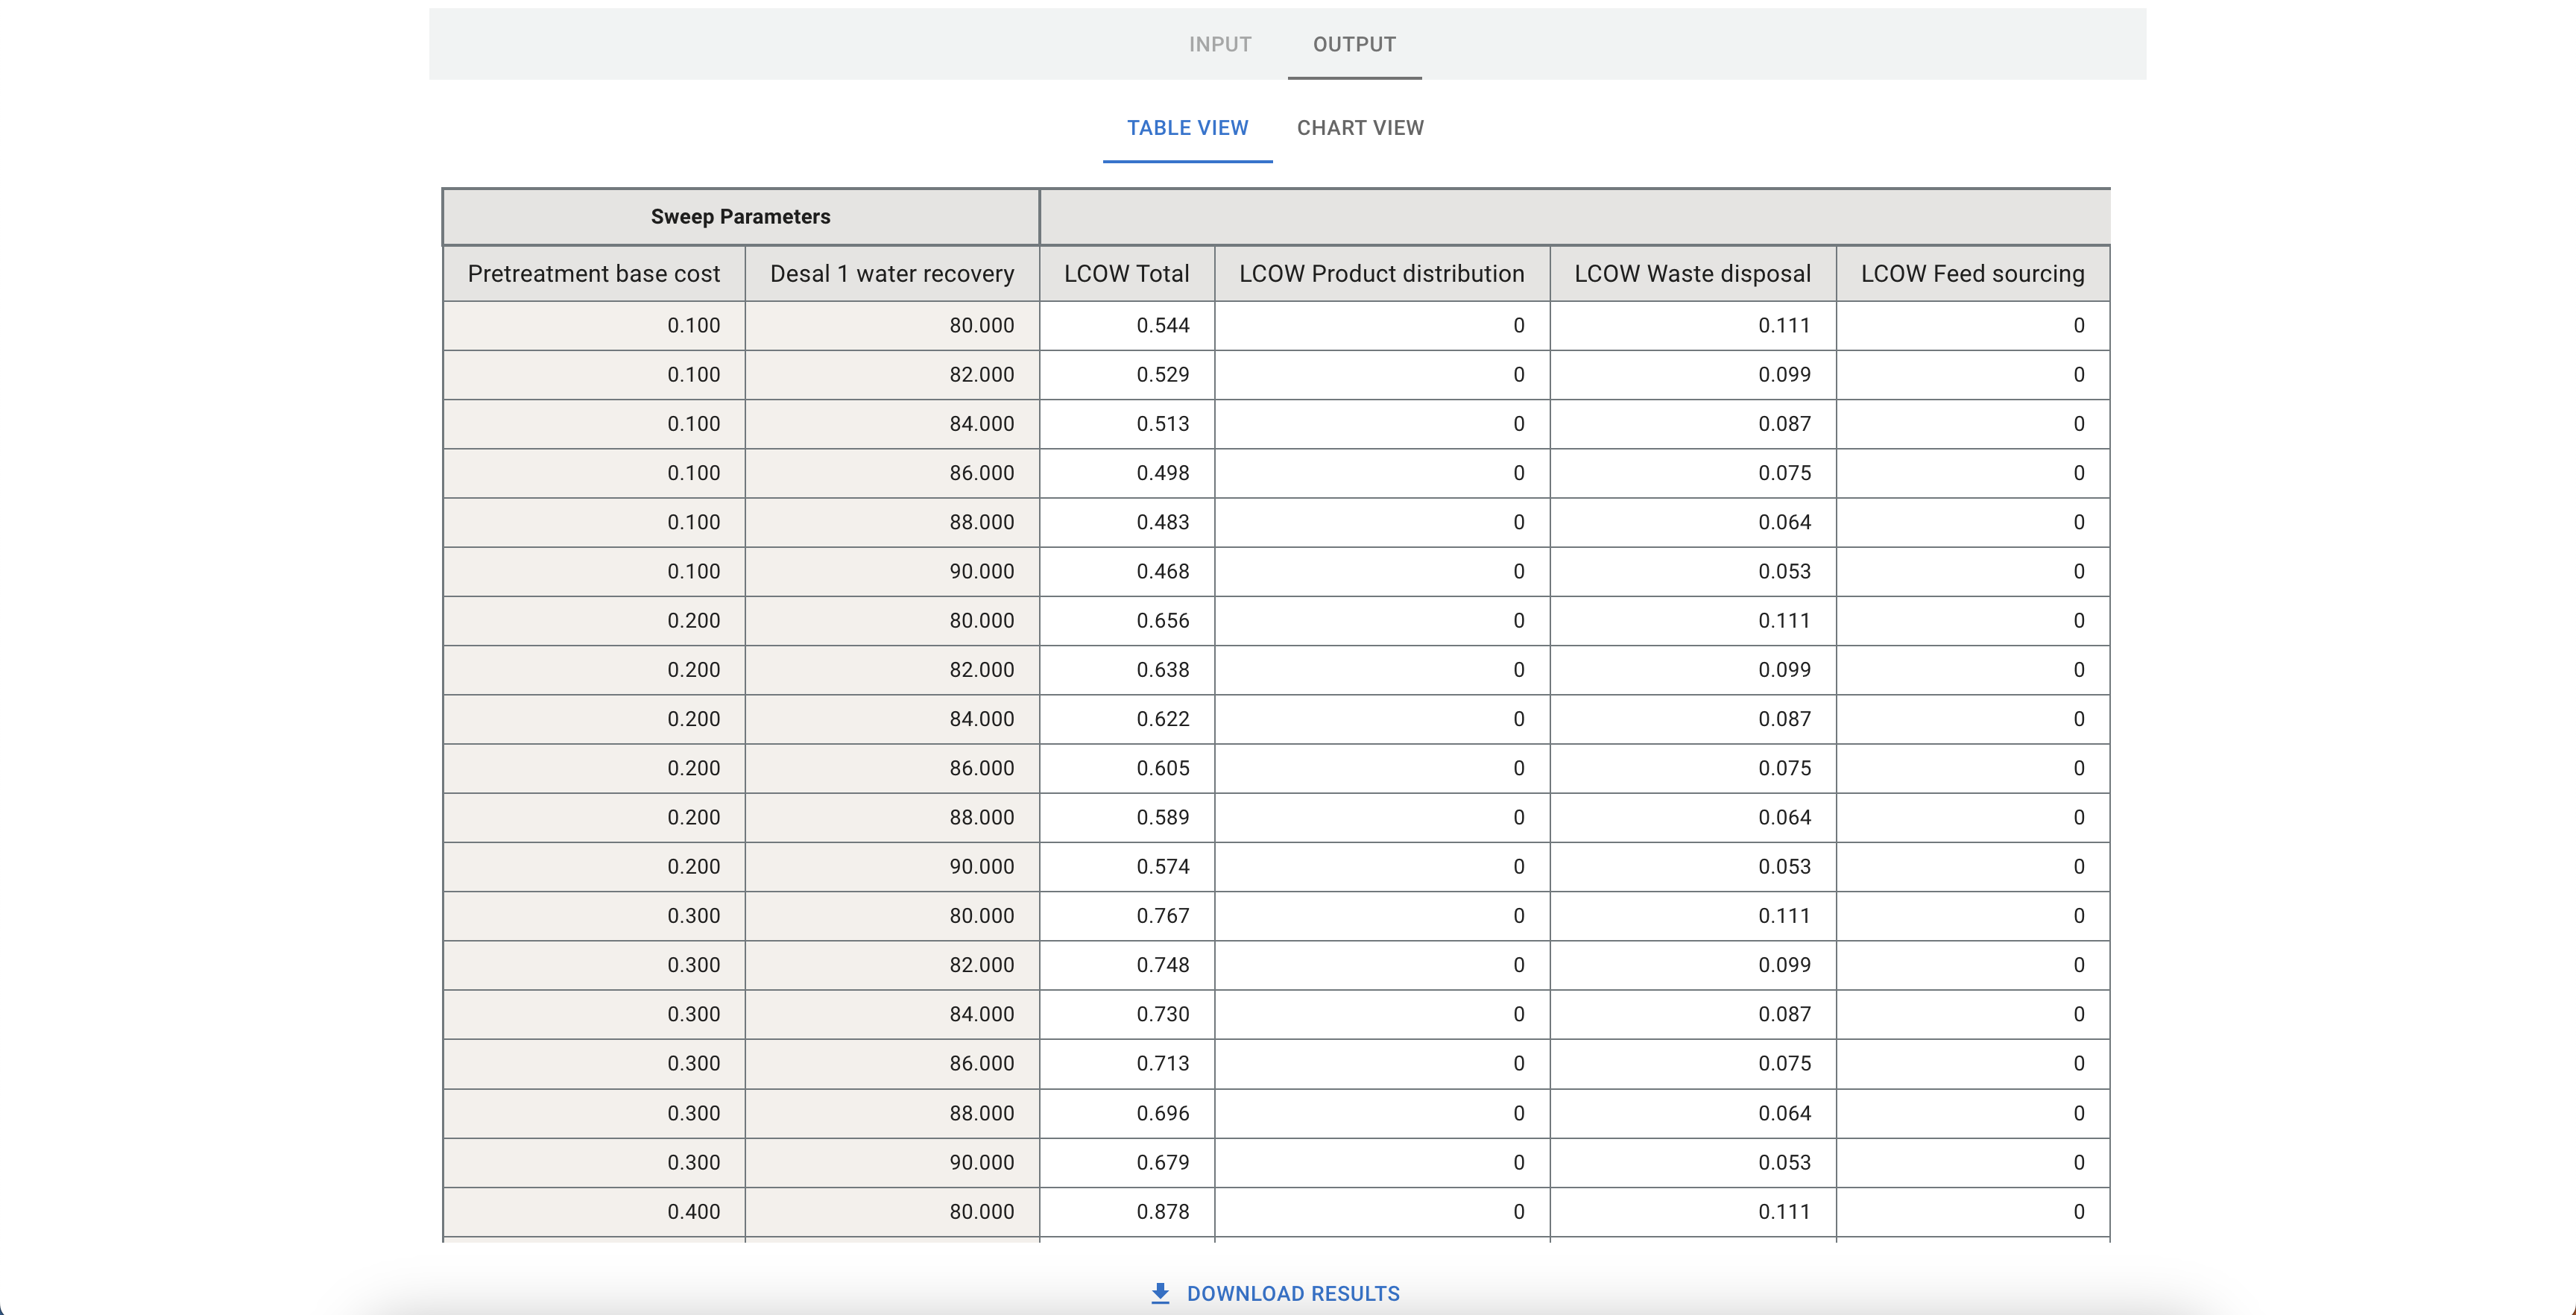
- Flowsheets can take anywhere from a couple seconds to several minutes to solve, depending on the model and operating system. Once the flowsheet has finished solving, you will see the output page. Here you can view the ouput of the model as a table. You can also save this configuration and download the results as a csv.
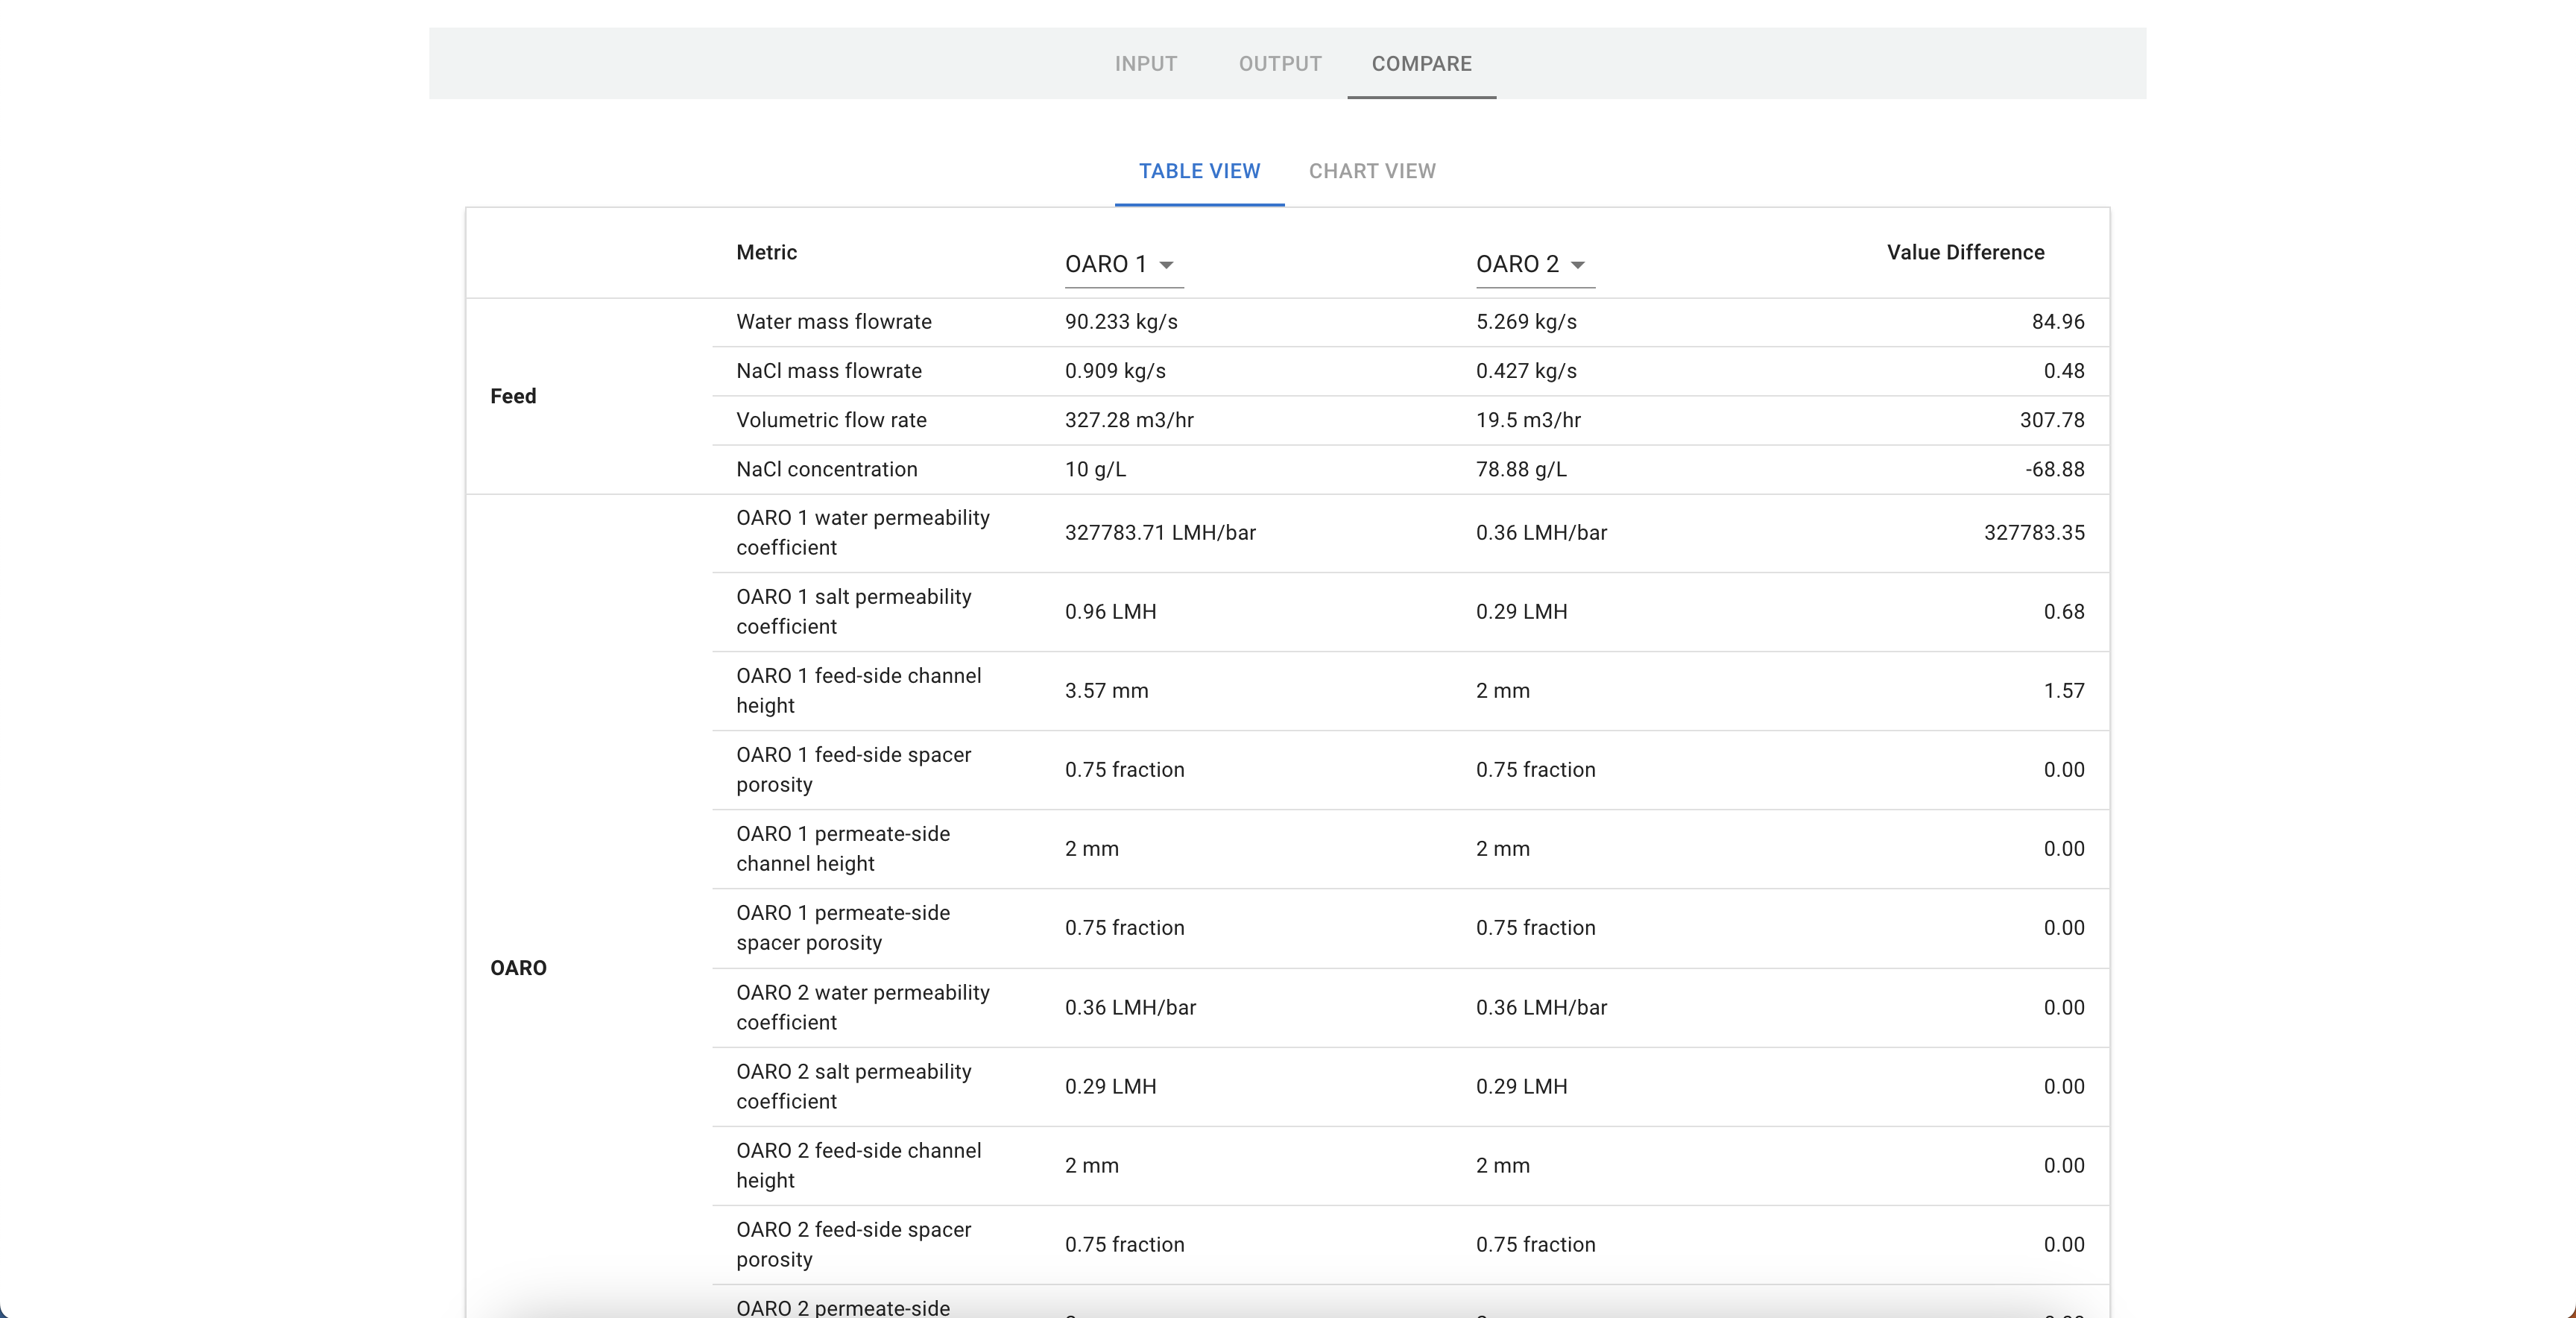
- From the output page, you can navigate to the compare page. Here you can compare outputs of saved configurations in a table and chart (coming soon) format. You can also download the table as a csv.
Run a sensitivity analysis�
- Select and build a flowsheet. Click the Analysis Type dropdown and select parameter sweep. Make sure to change at least one variable from fixed/free to sweep. Click Run.
- Sensitivity analyses run multiple optimizations, so they take longer than a single optimization run. Once the analysis is complete, you will see an output table.
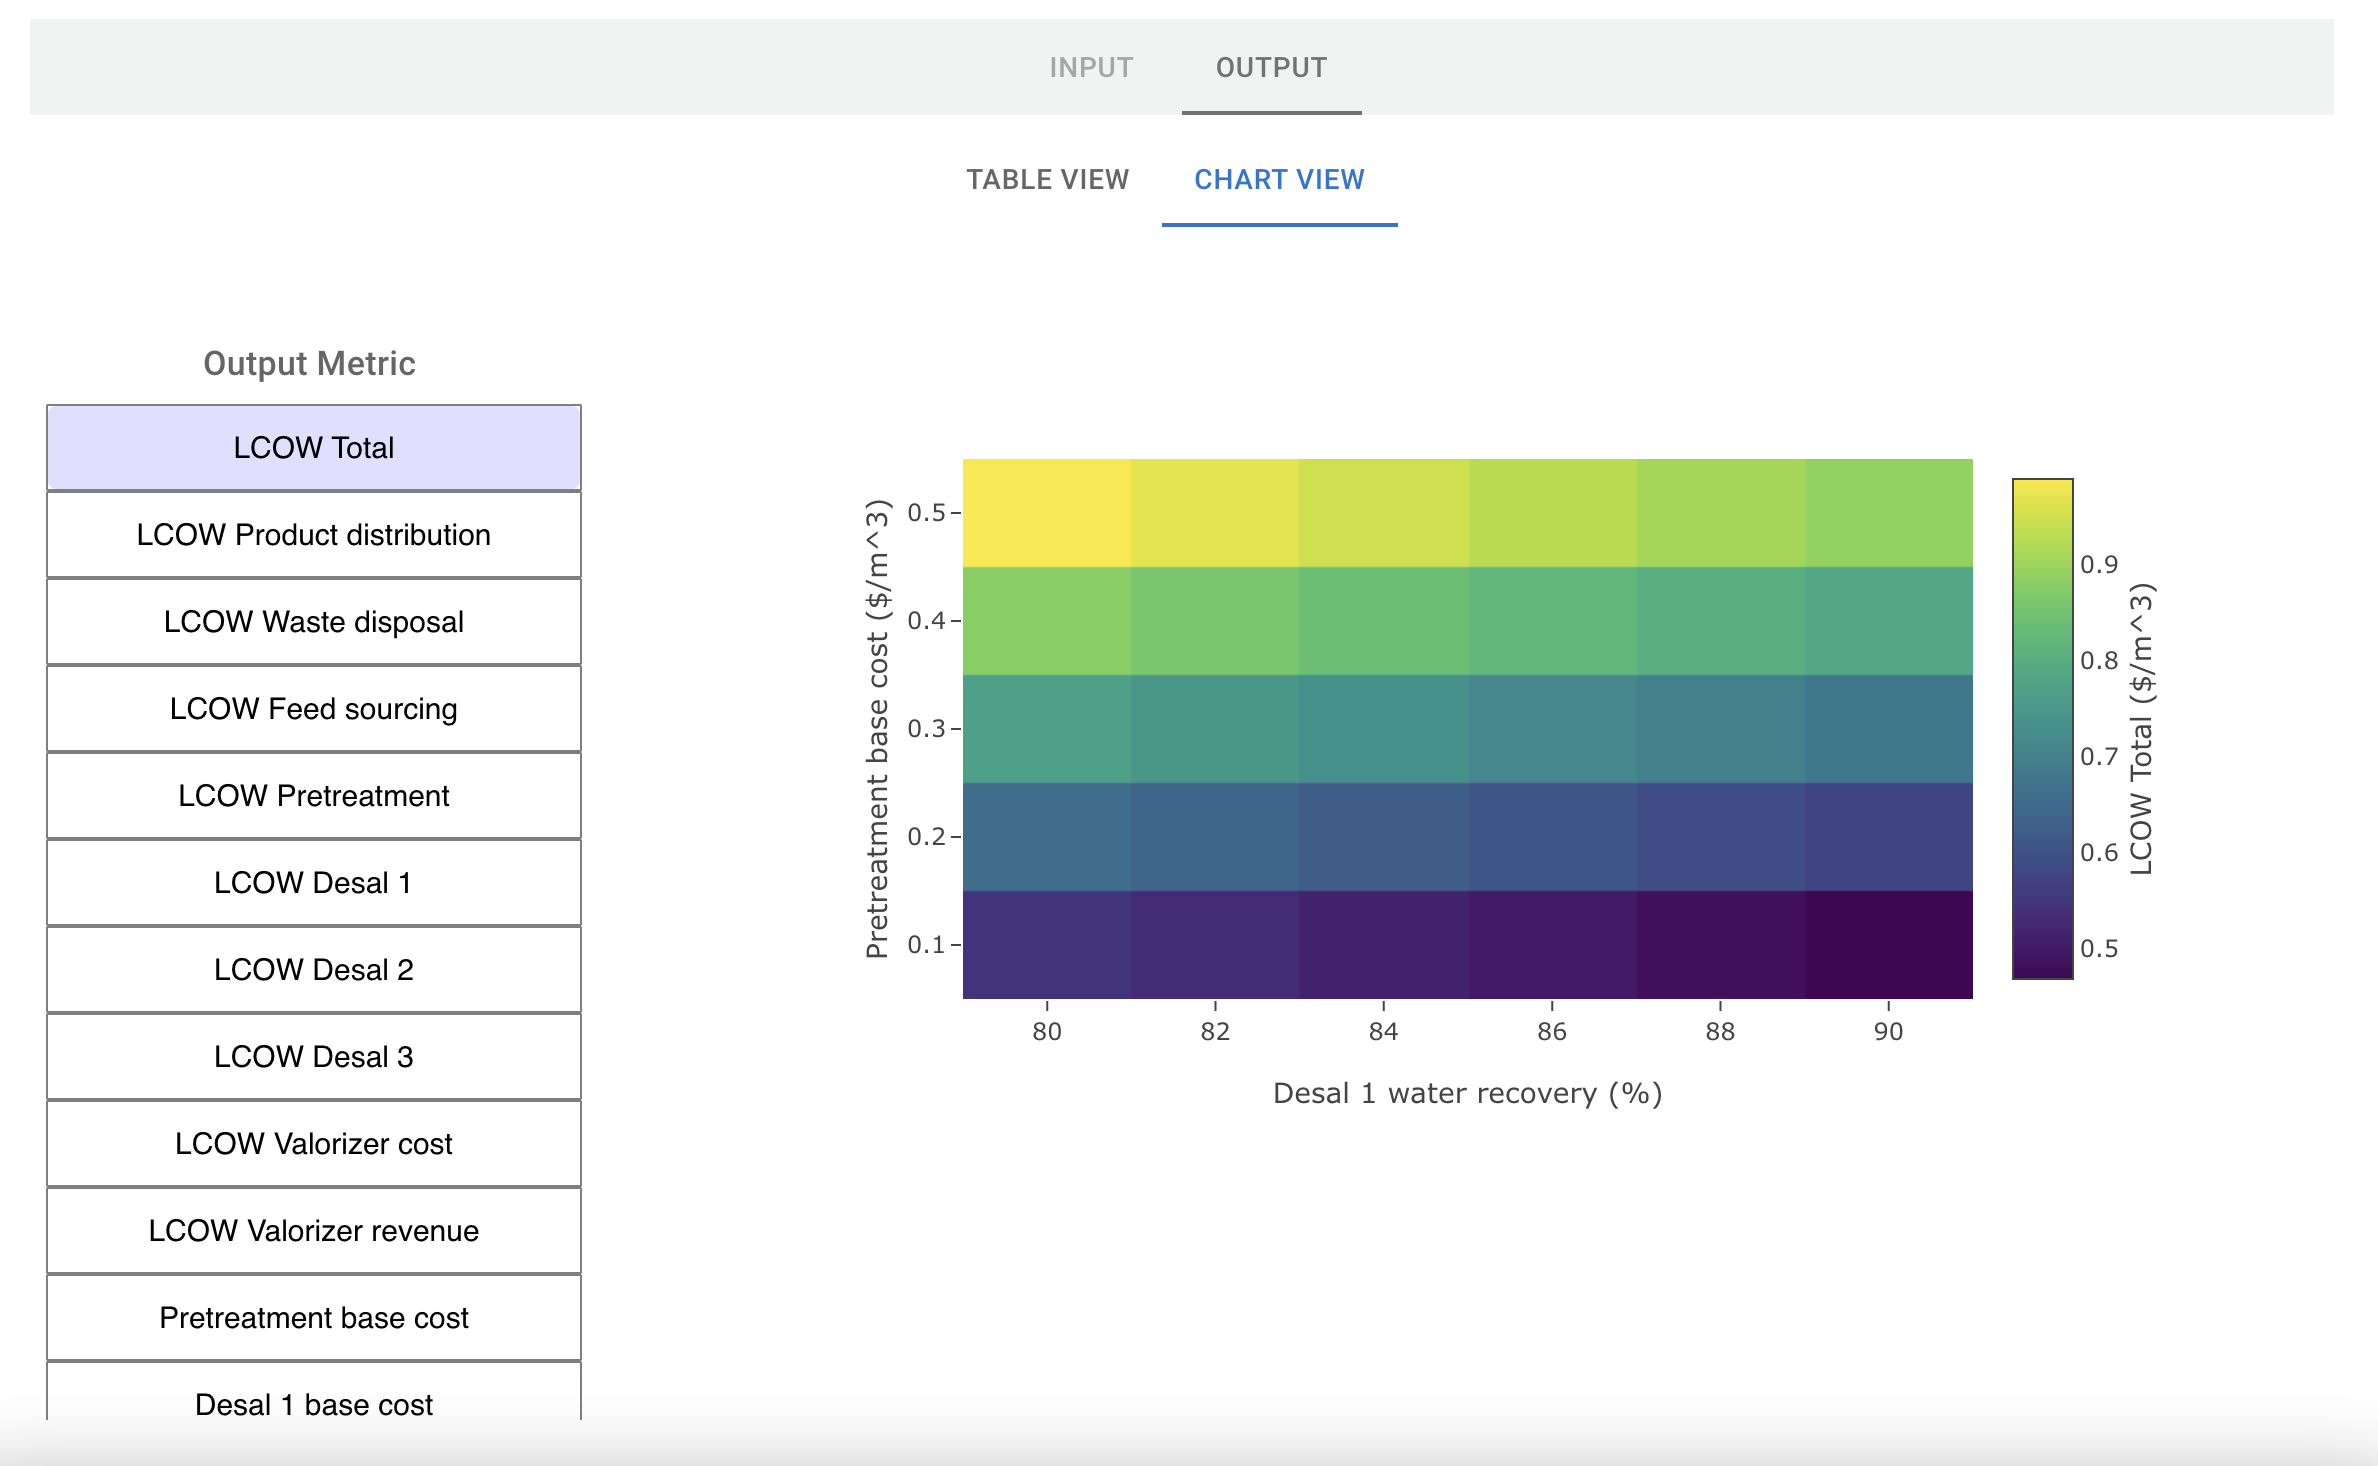
- To view the output in a chart format, click on Chart View. The chart type will vary depending on the amount of variables that were involved in the sweep. For one variable, you will have the option to view and interact with a line chart. For two, the chart type will be a heatmap. For three or more, a parallel coordinates plot.
Upload a flowsheet
For developers, you may have a flowsheet that is not preloaded into the UI. To upload a flowsheet dynamically into the UI, follow the steps below.
- Navigate to the flowsheets list page. Click on New Flowsheet +. You should see the following:
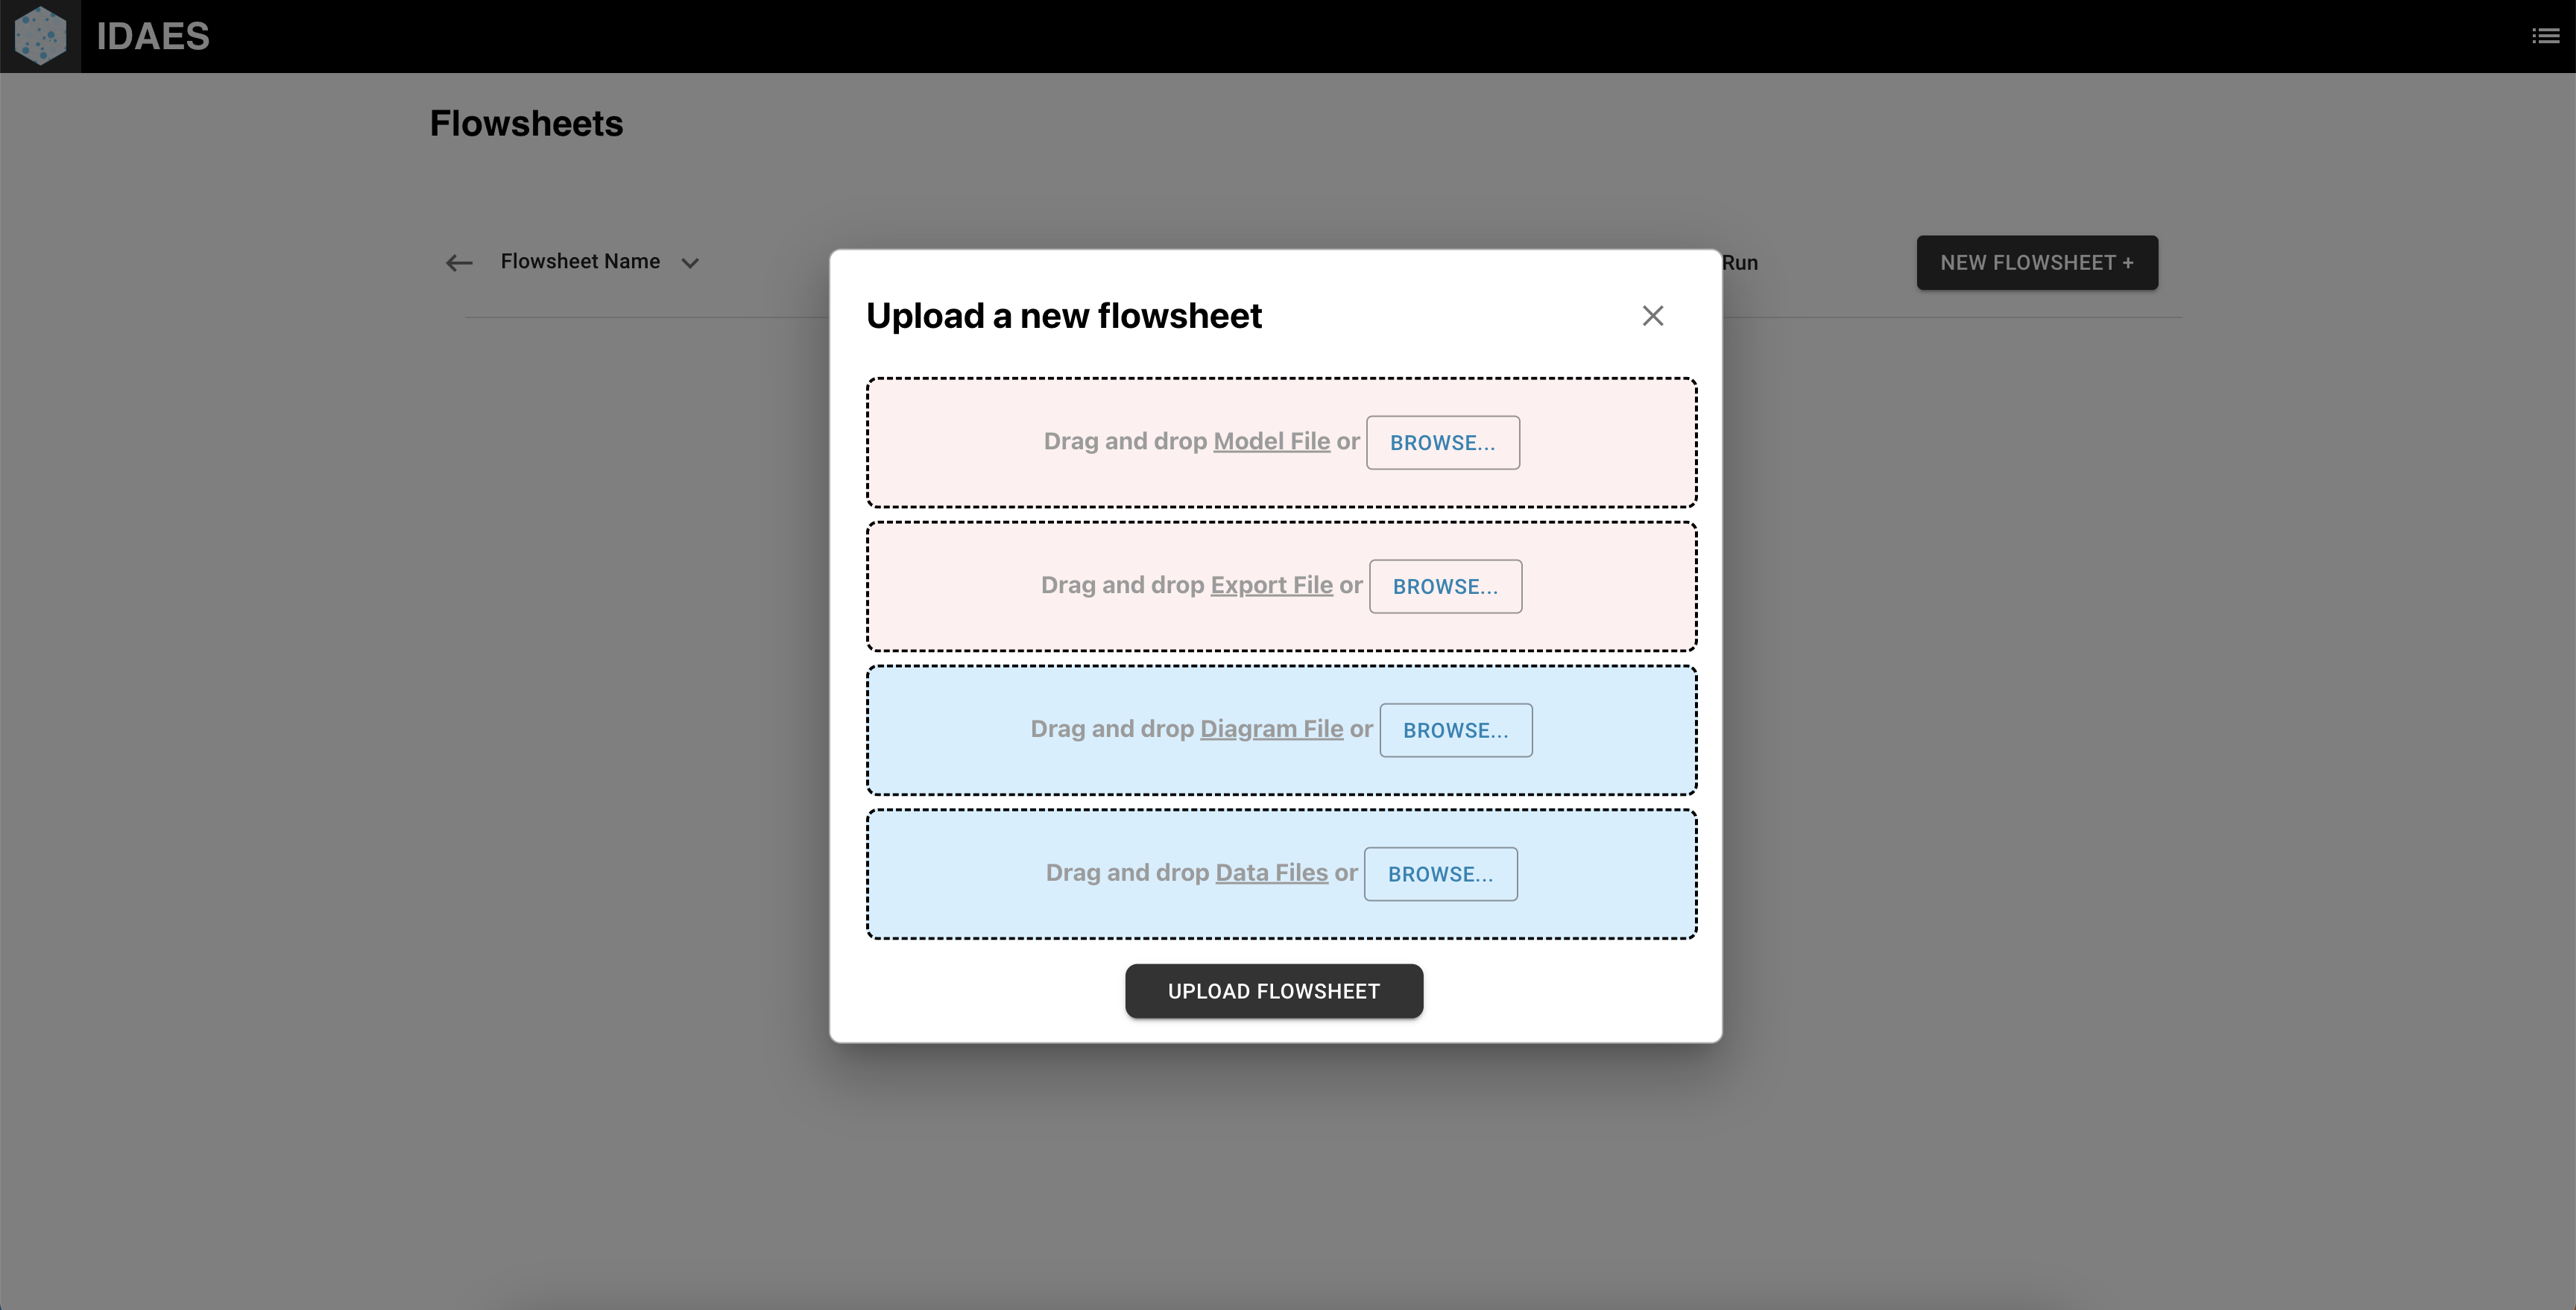
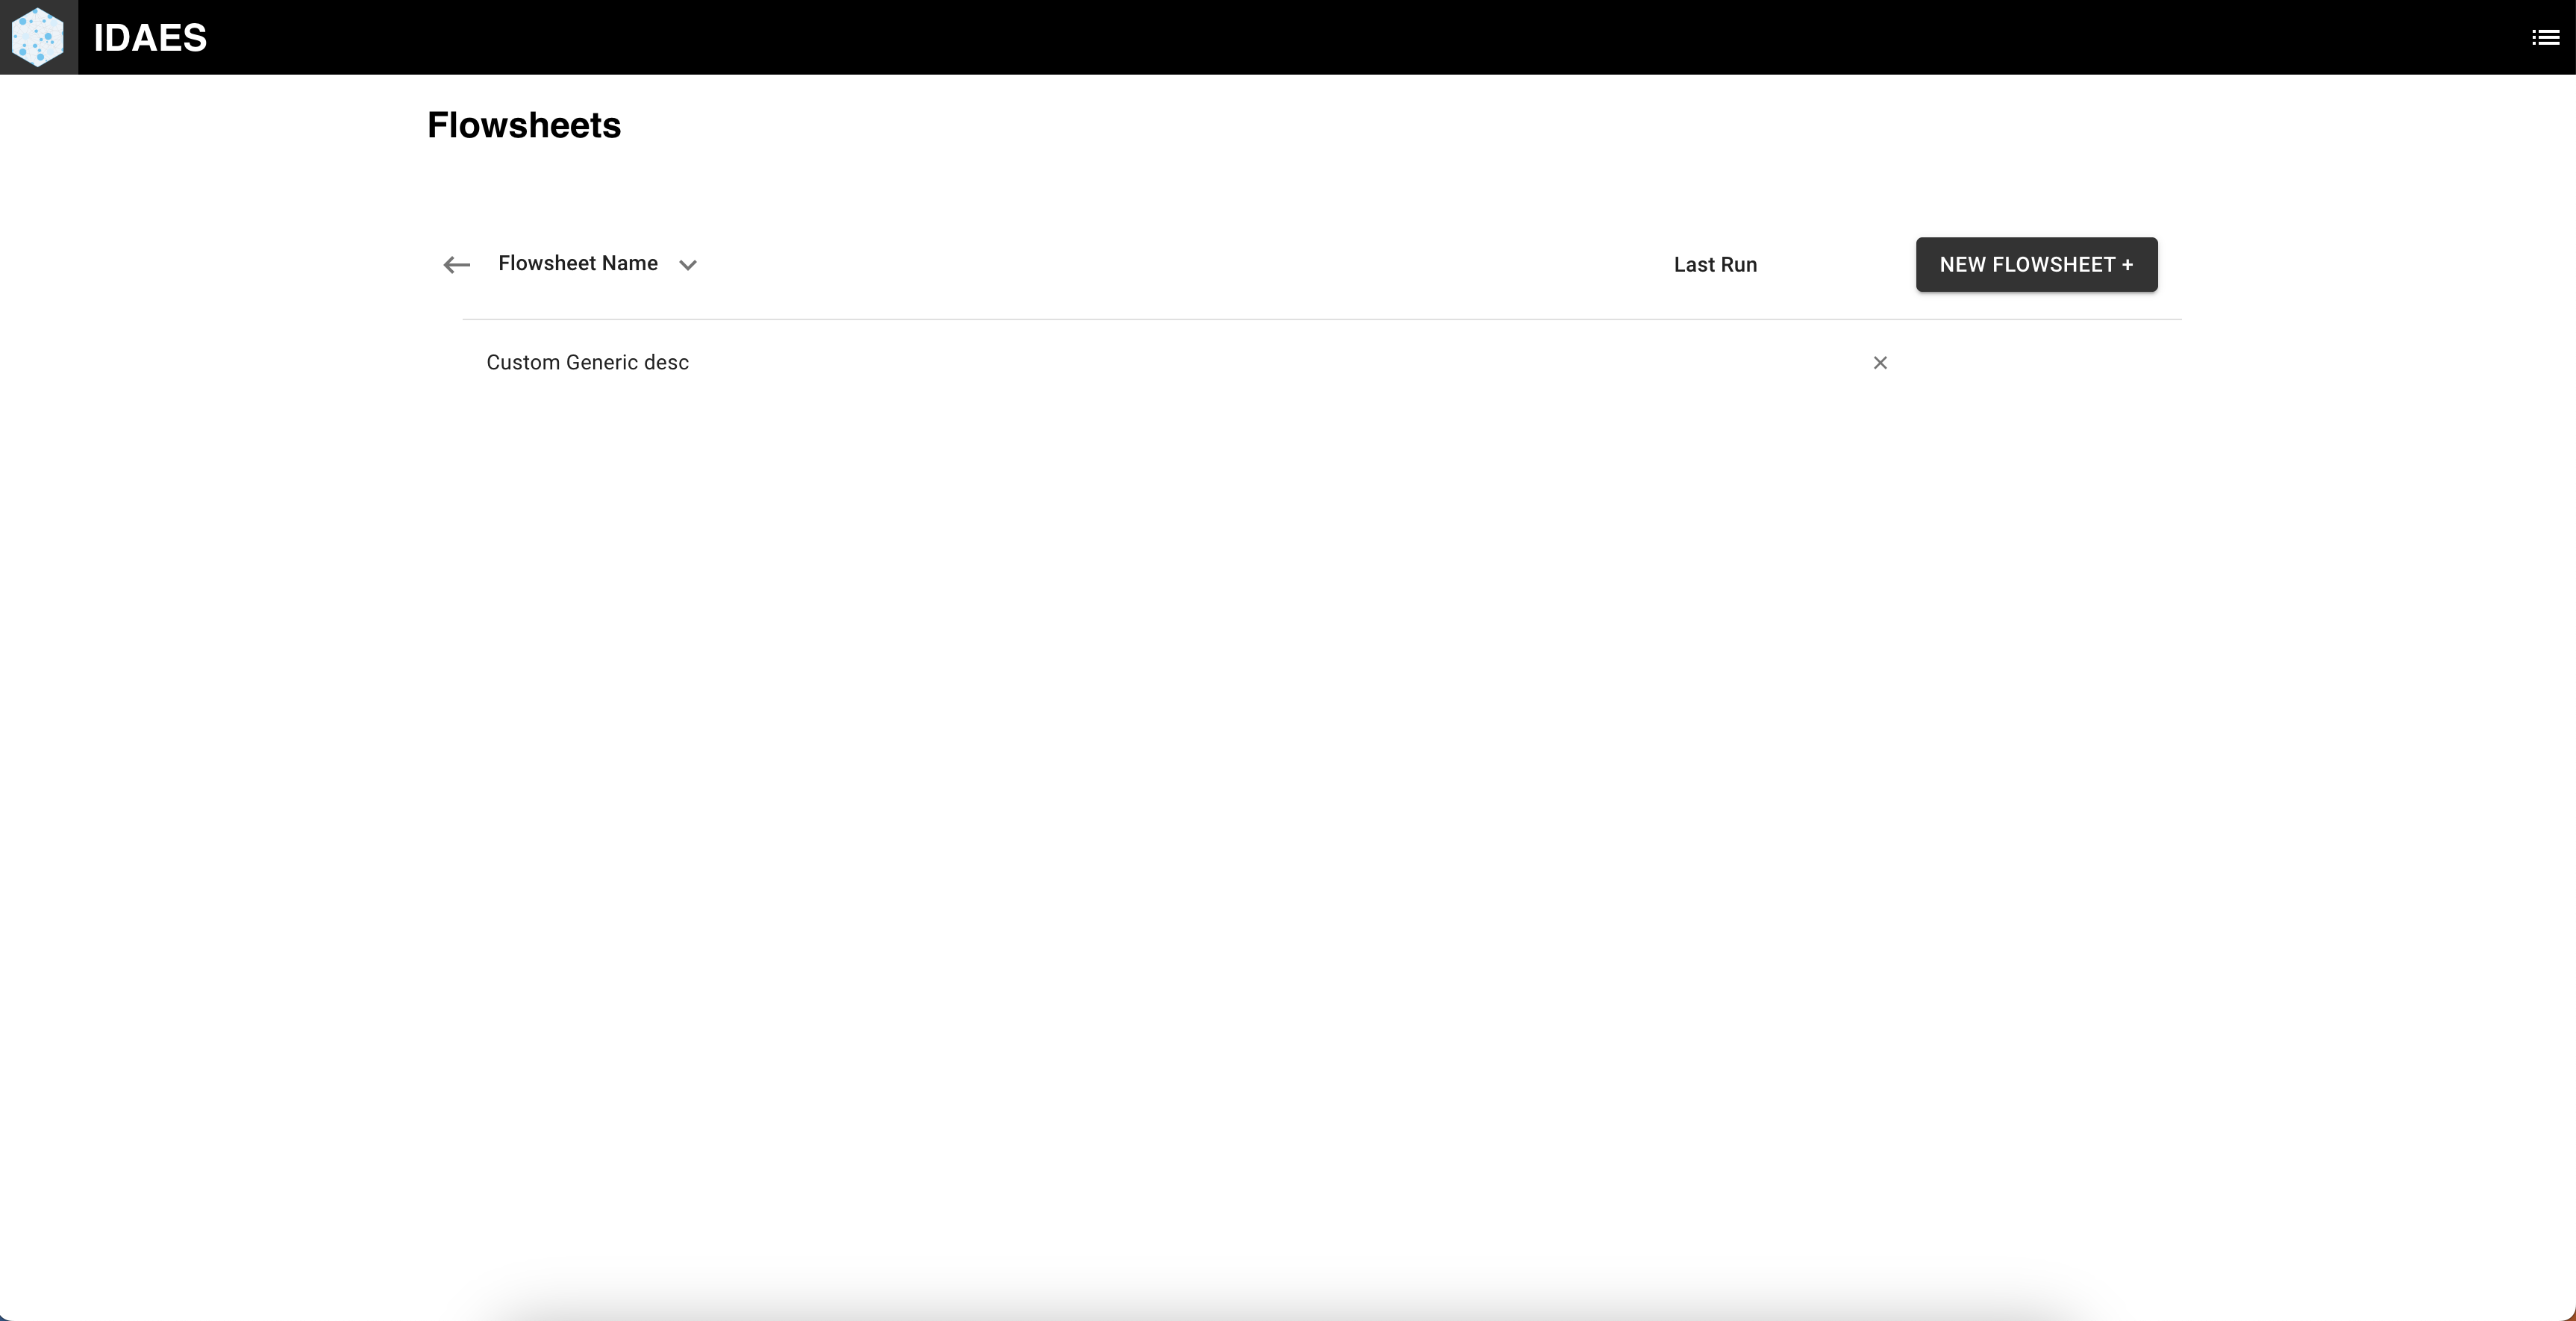
- A flowsheet python file and an export python file (see how to export a flowsheet) for that flowsheet are required. In addition, you can upload a diagram of the flowsheet and any necessary data files (yaml, json, csv, etc). After attaching the files, click Upload Flowsheet. If successful, you should see the page refresh and see your flowsheet populate in the list. If unsuccessful, you should see an error popup.
Switch UI Project Version
If you would like to switch project versions (eg. from WaterTAP to PrOMMiS), click on the project name in the top left: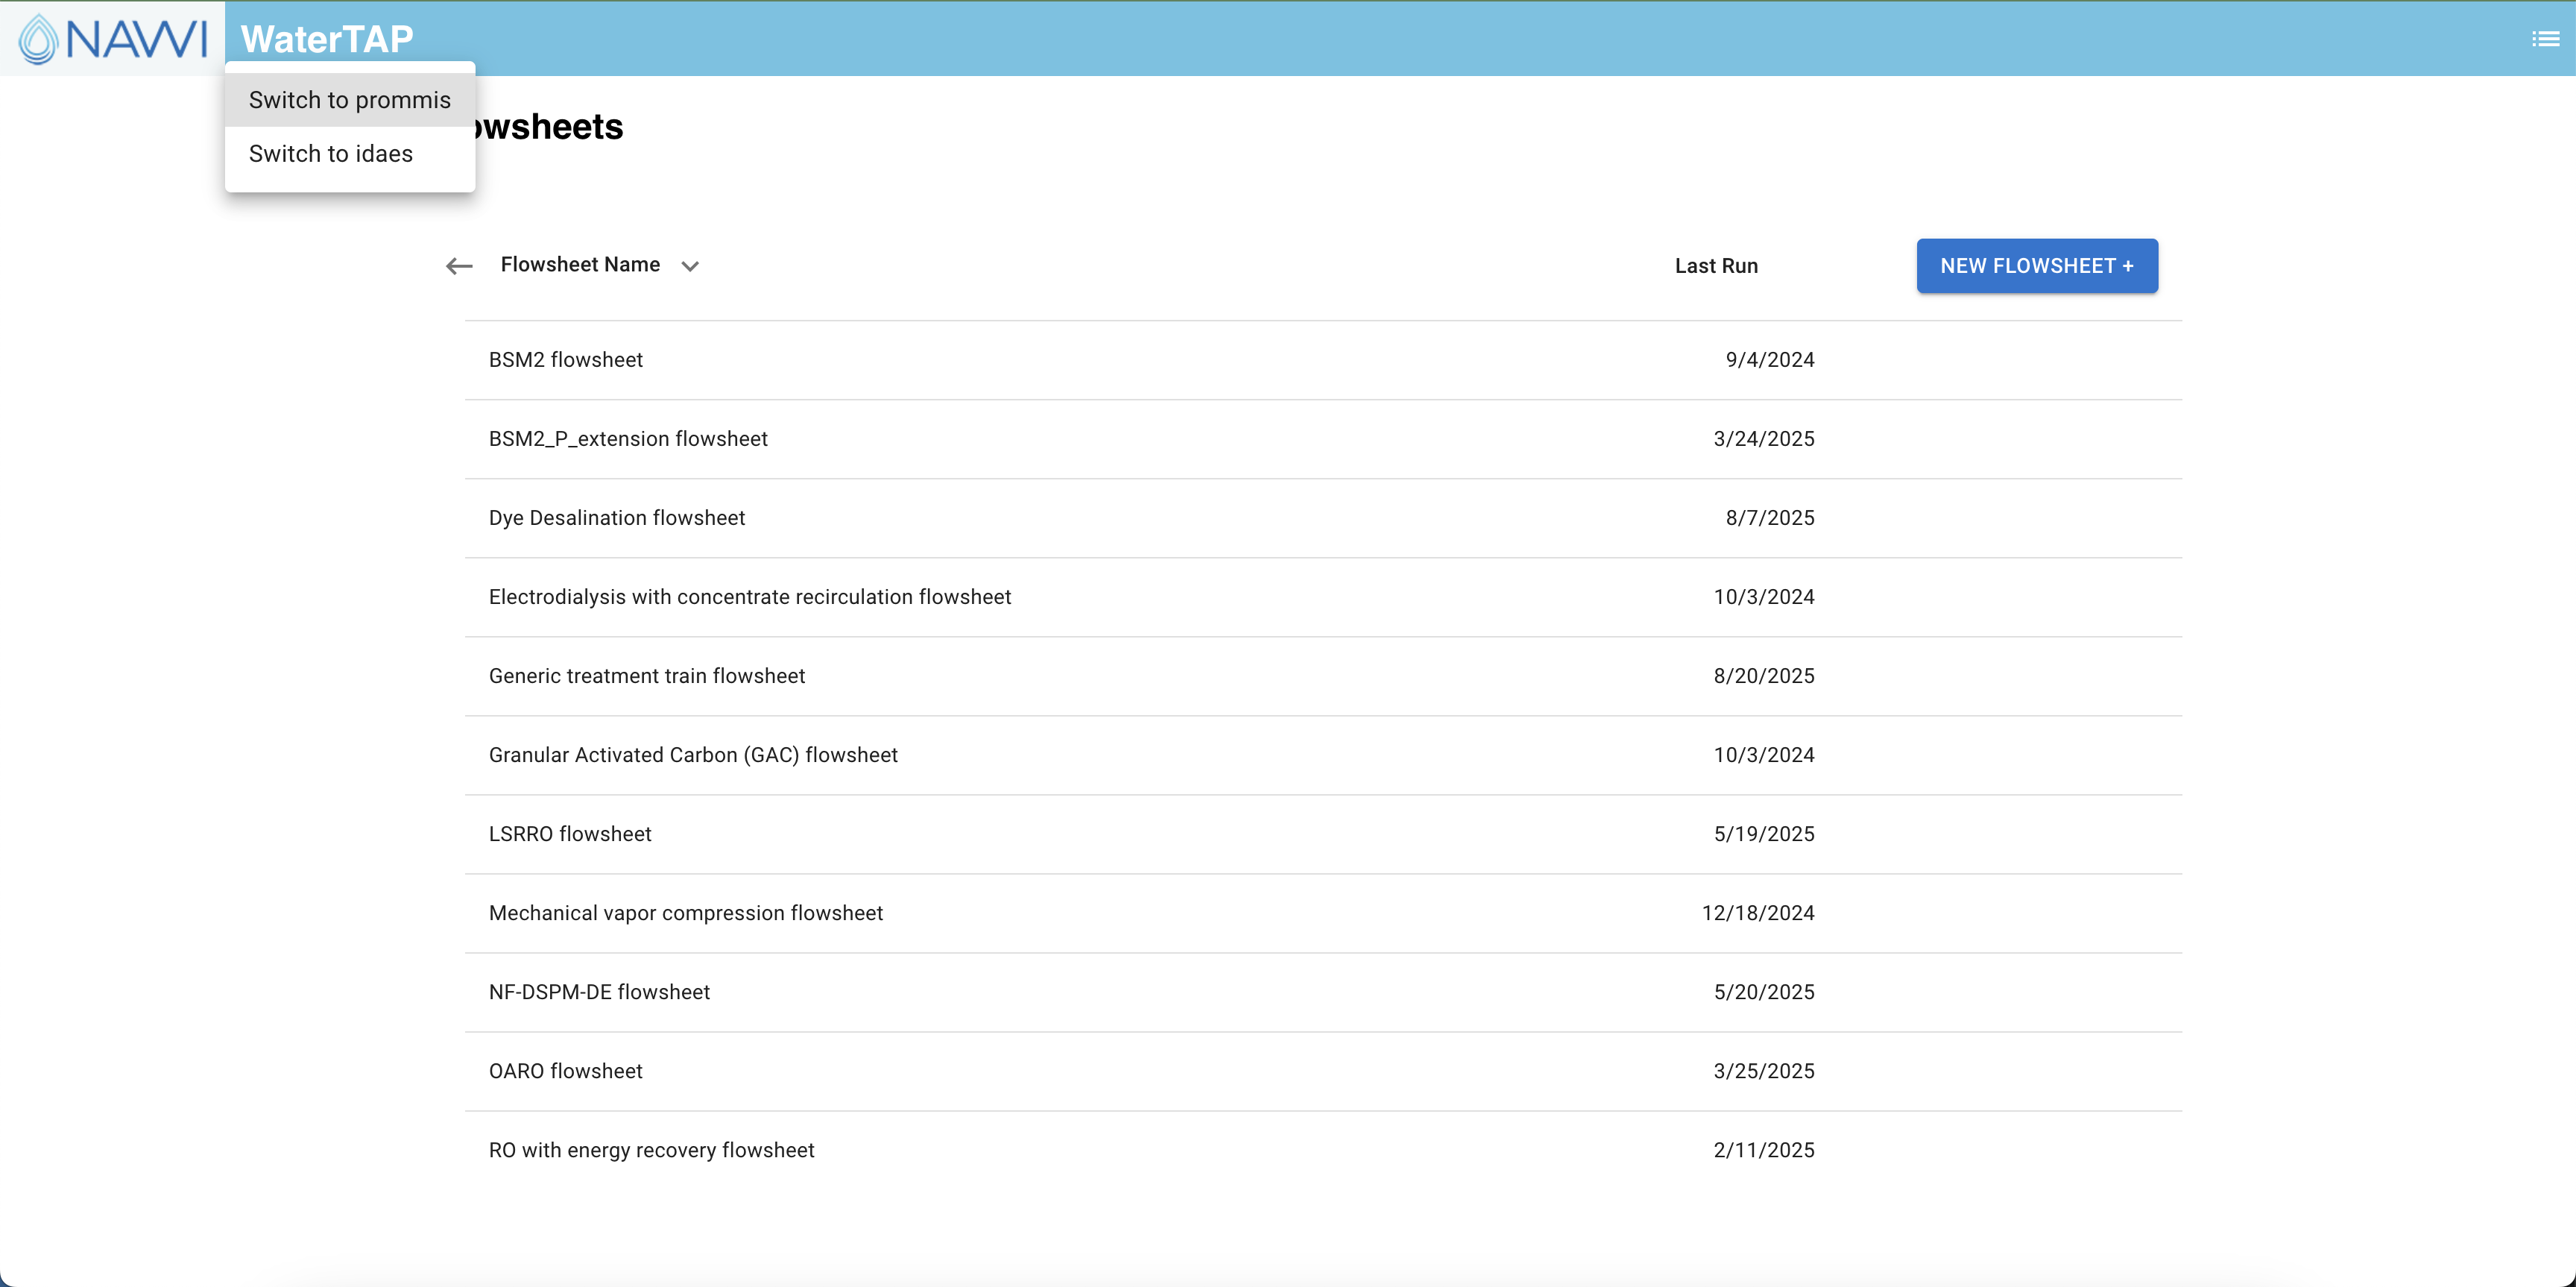 Note: This feature is only availabe in development mode and in the generic release of the Flowsheet Processor UI.
Troubleshooting
If you run into an error when building or solving a flowsheet, the UI has a feature that allows you to view the logs including any model outputs. To view logs, click the menu icon in the top right and choose "View Logs":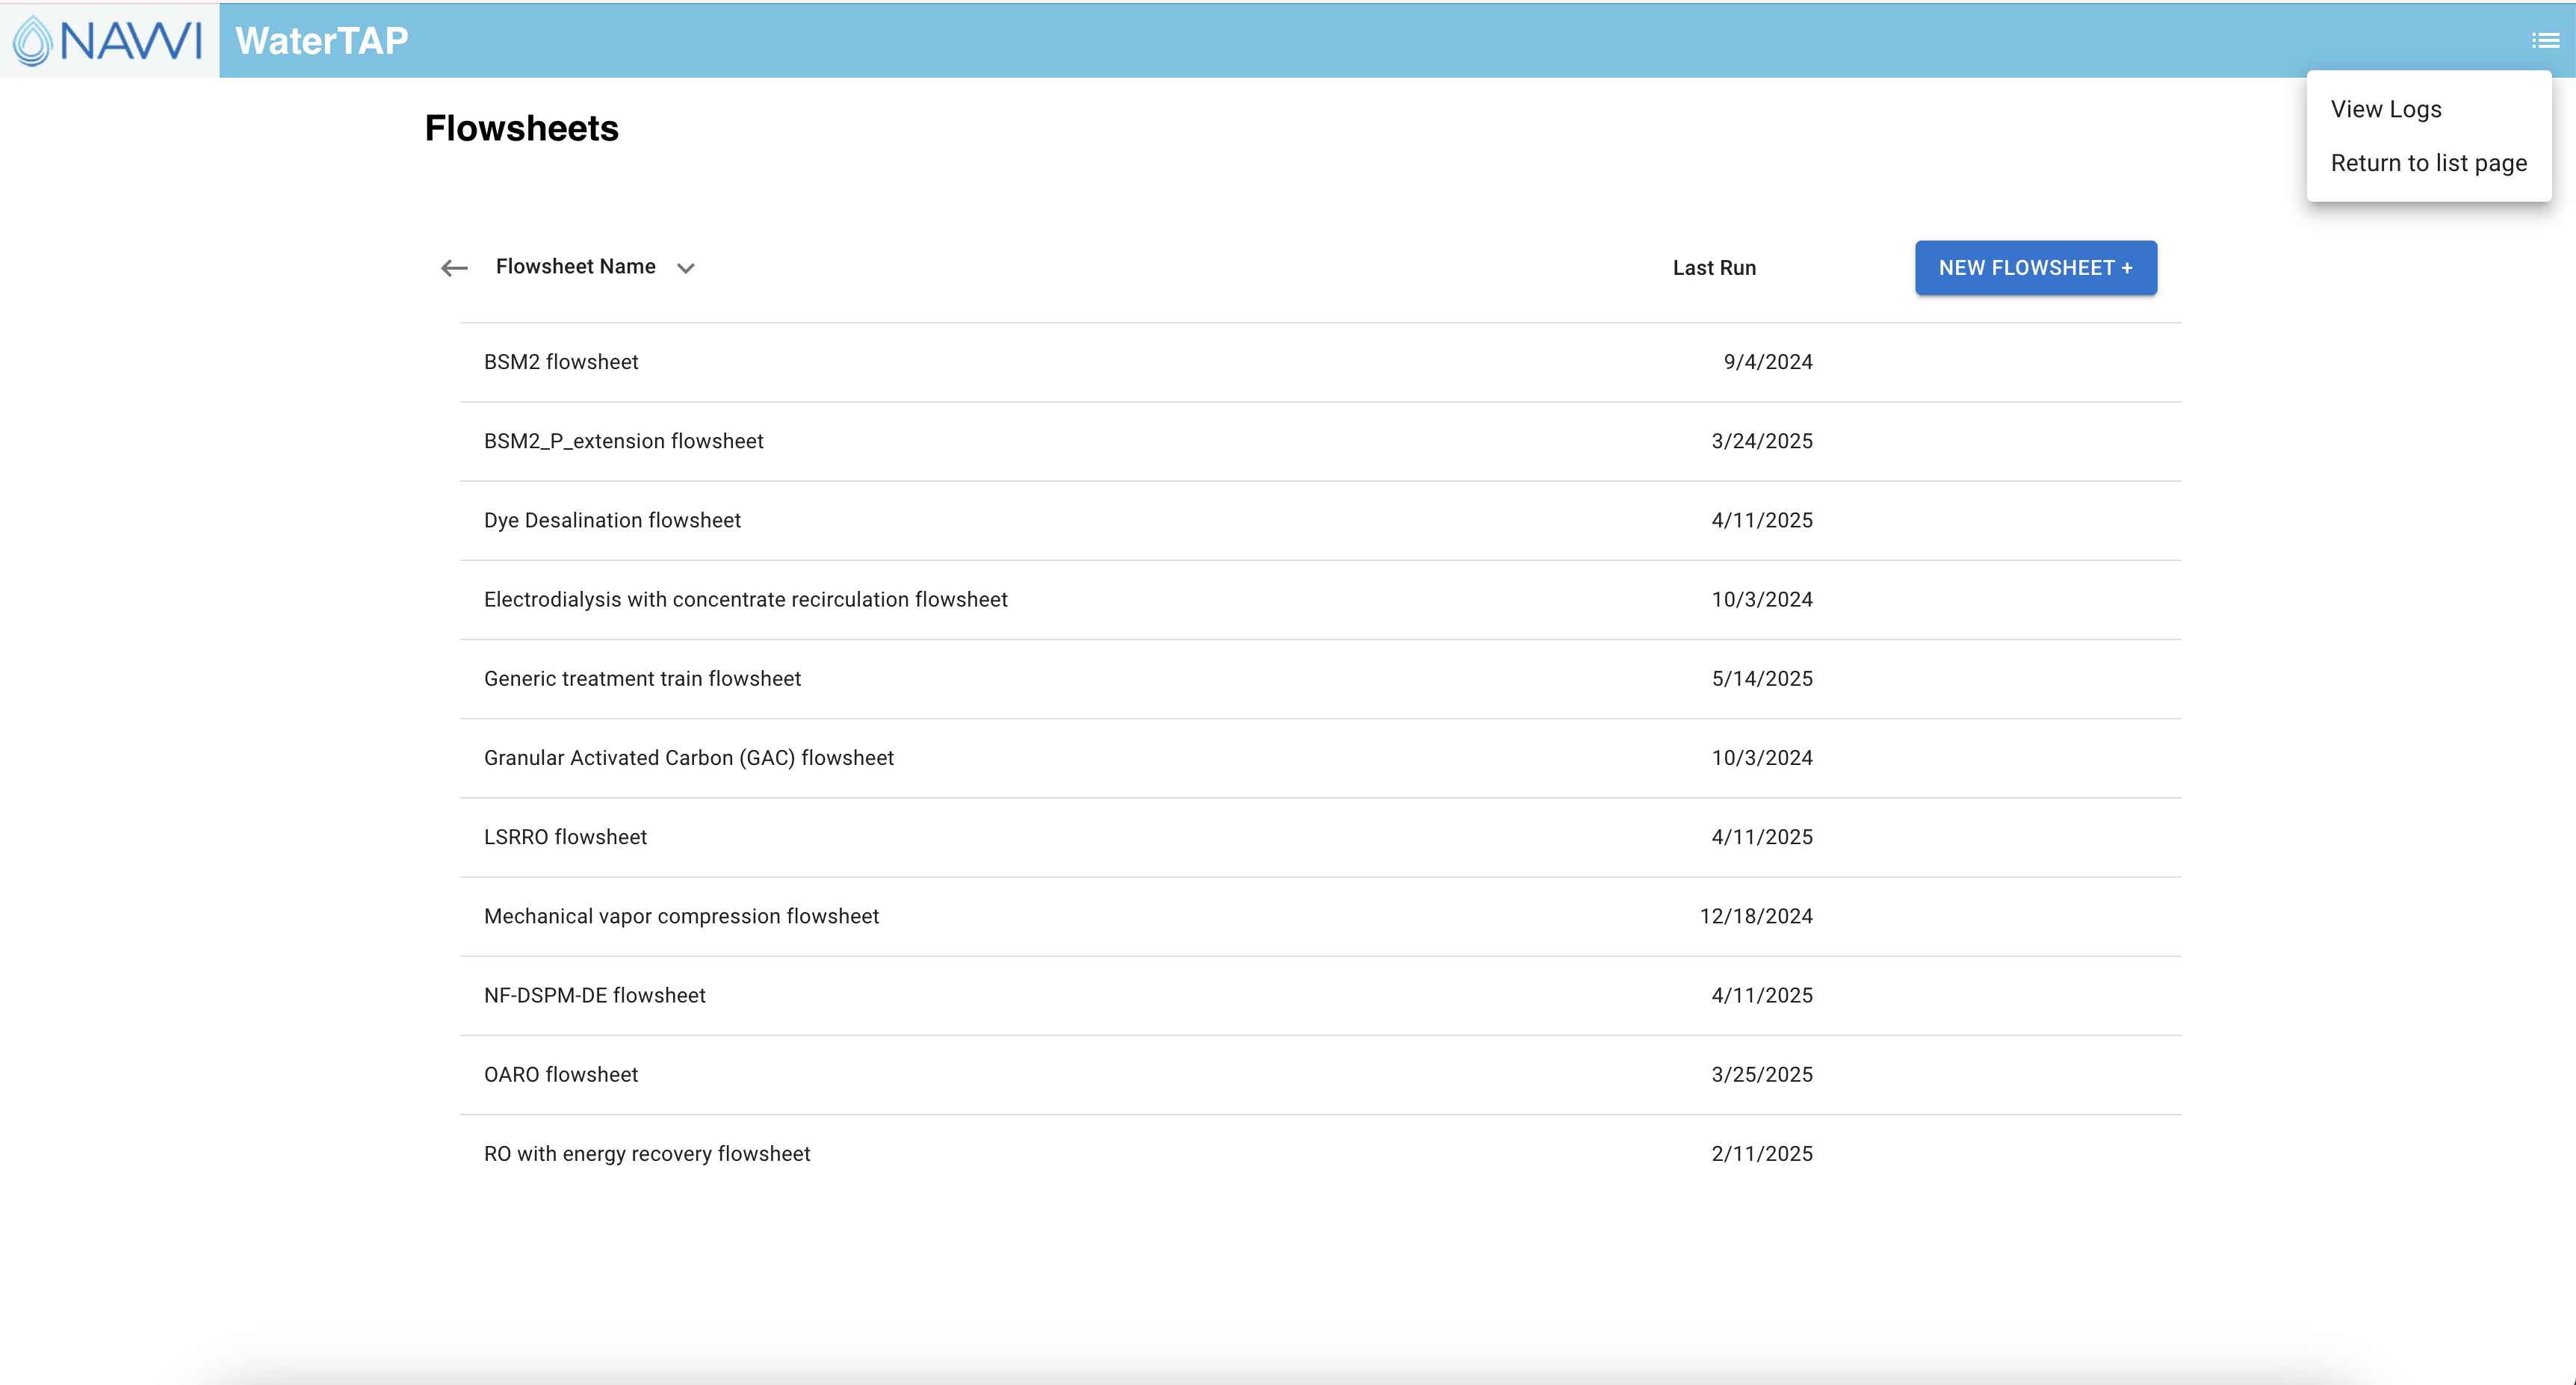
Logs are searchable, downloadable, and filterable by log level. Furthermore, they are color coded to enhance the user experience: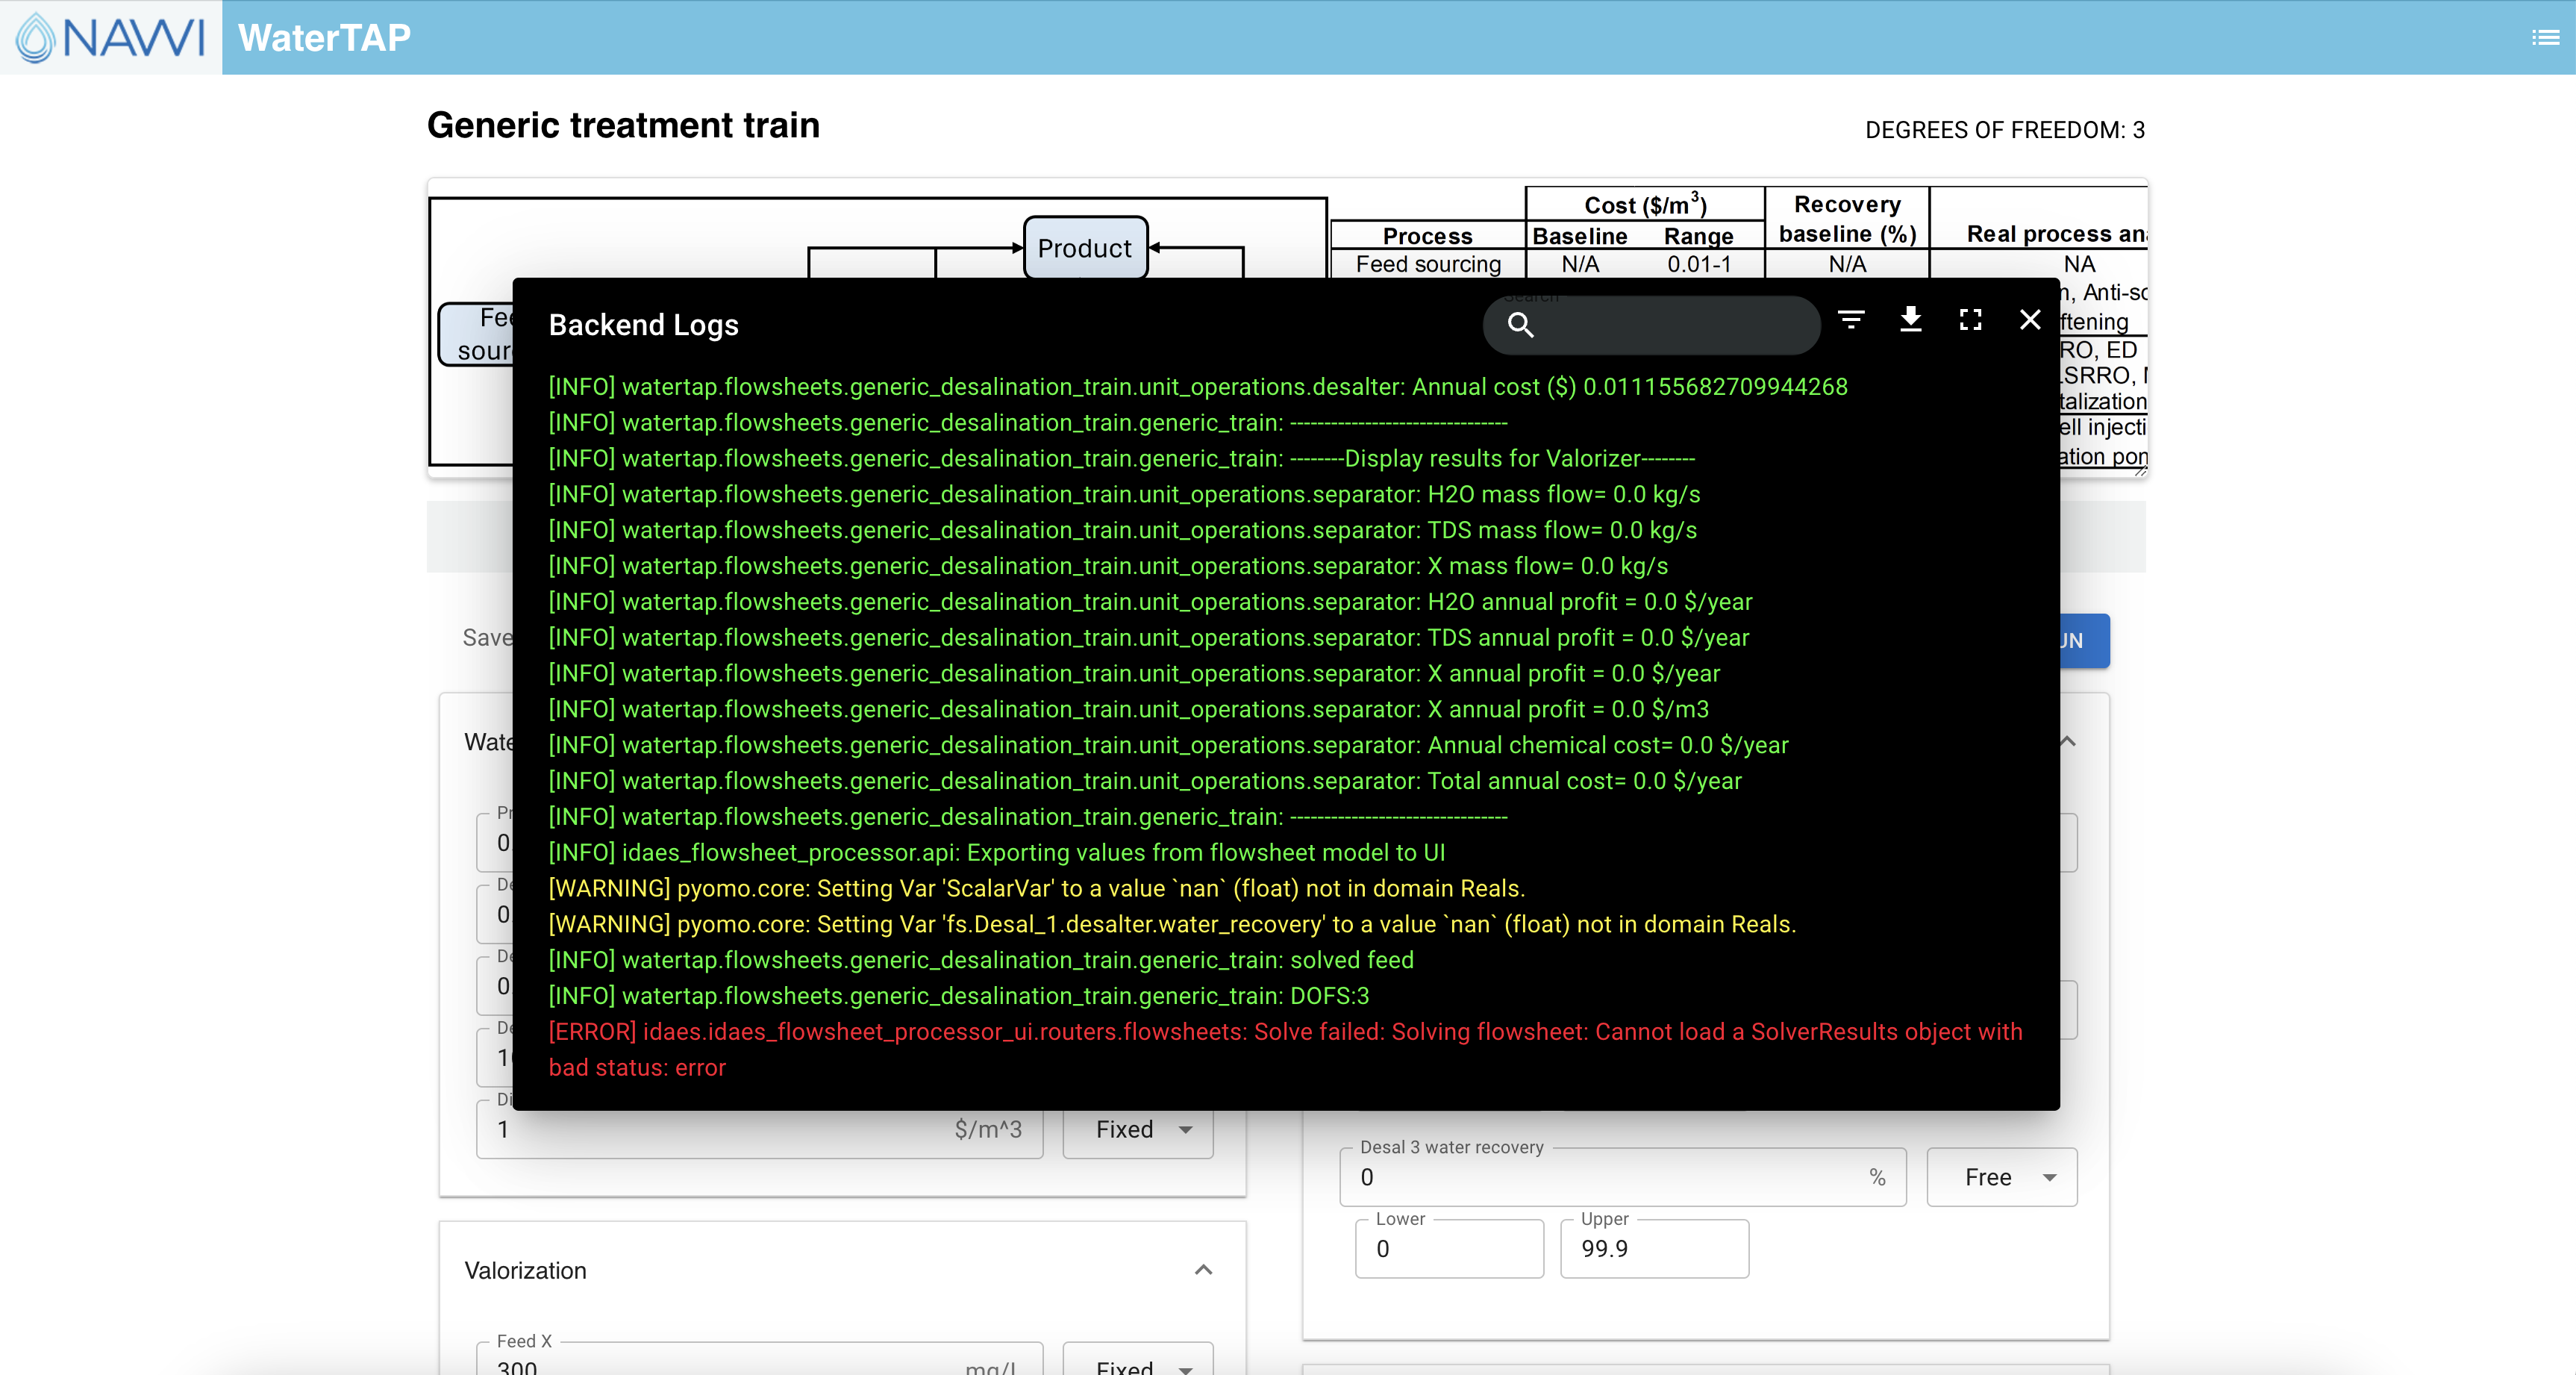
If logs are unhelpful, you can navigate to the Github website and create an issue for the error you are running into. Make sure to include which flowsheet you were running, which computer operating system you were using, and if possible, provide the input values that caused the error.